Cracking the Code: Extending ESP Run Life, Even With High Gas/Oil Ratio
Three case studies consider the gas-related reasons electrical submersible pumps fail in unconventional shale environments.
As an industry, we have the data, understand the physics, and have the tools required to deliver production optimization in unconventional wells.
RoschetzkyIstockPhoto/Getty Images/iStockphoto
Unconventional shale plays present a unique challenge for electrical submersible pumps (ESPs). Long a workhorse in conventional wells, ESPs can struggle in unconventional settings due to the increase in gas/oil ratio (GOR) and associated gas void fraction (GVF), which causes both slugging and head degradation. More importantly, this leads to repeated zero-flow events, which both reduce the ESP run life and increase deferred production. While an increase in GOR is inevitable in unconventional wells, with the current industry’s ESP gas-handling knowledge, solutions exist to delay the onset of zero-flow events without impacting net present value (NPV), i.e., high early rates.
In short, the industry has cracked the code on ESP gas handling in unconventionals. This is the essence of the three case studies included inSPE 219556, which is the culmination of years of work seeking to understand how ESPs interact in two-phase flow. The paper draws on fundamental research carried out at several universities, notably the University of Tulsa and the University of Cambridge.
Key references are Francisco Alhanati in 1994 (SPE 28525), Roberto Cirillo in 1998, Jose Gamboa (SPE 163048), Vieira and Prado in 2013, and Marine Dupoiron in 2018, all of whom provided theory and lab test data in their masters of science and doctor of philosophy theses to support our understanding of the underlying physics. They explain the numerous factors that impact pump tolerance to free gas, but the three that are pertinent to this article are summarized below.
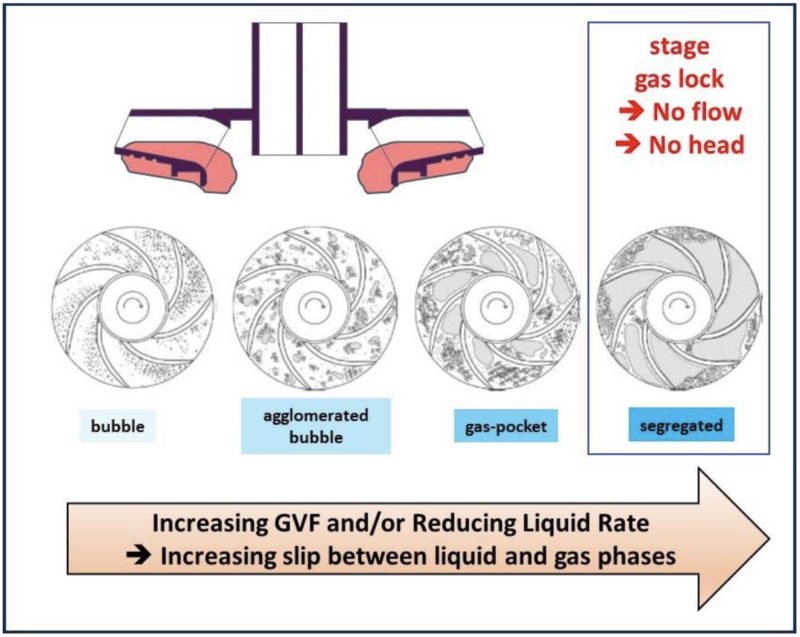
Head degradation is due to both the liquid rate as well as the GVF. This combination is also known as the flow regime, and its influence on gas-bubble size impacts head degradation (Fig. 1).
Fig. 1—How flow regime impacts head degradation.
Source: SPE 219556.
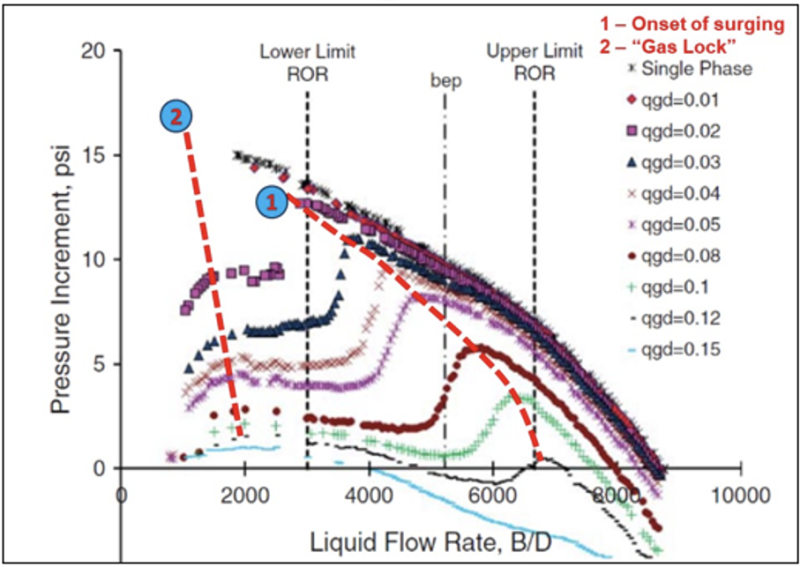
The pump curve does not maintain its shape in the presence of free gas. For a given GVF, there is a “step” change drop in differential pressure of 30 to 70% when operating at liquid rates less than the best efficiency point (BEP). This is best explained by the test data provided by Gamboa in SPE 163048 and reproduced here with annotations to illustrate the phenomenon (Fig. 2).
Fig. 2—How the pump curve changes shape in the presence of free gas. Improved identification of the onset of surging and gas locking, courtesy of Gamboa (2008). By plotting the differential pressure as opposed to the head and showing lines of constant gas rate (as opposed to constant GVF), tests confirmed substantial pressure breakdown with the onset of surging (see boundary line 1). Eventually, there is a complete loss of pressure increment when operating beyond boundary line 2. In this series of tests, speed and PIP are constant at 3,000 rev/min and 150 psig, respectively.
Source: SPE 163048 and SPE 219556.
Wellbore slugging causes fluctuations in ESP current and pressure, which can easily be misinterpreted as head degradation. Vieira and Prado 2013 demonstrated that slugging creates large periodic fluctuations in downhole ESP rates, which often include zero-flow events. Over time, the repetitive nature of these zero-flow events is damaging to the ESP due to the lack of cooling and the mechanical wear, which both reduce the ESP run life. They also cause deferred production, which is typically between 10 and 30%. Horizontal wells are effectively “slug machines” because of phase segregation in the drain, but one should not underestimate the severity of slugging in the production tubing due to declining liquid rates, which is also common.
Early in the well’s life, the reservoir pressure is high and GOR is low. At that time, life is good and production is steady, but when the pressure in an unconventional reservoir is depleted, the pressure needed to lift the well increases, but so does the head degradation due to free gas. This leads to the pump generating some pressure but not enough to lift the well; the resulting problematic situation is one of insufficient lift. The result is no flow to the surface, i.e., a zero-flow event. This is commonly referred to as “gas lock.” However, insufficient lift is a more appropriate name, as it is caused by not only head degradation but also slugging, especially in unconventionals. Irrespective of the cause, the result is deferred production and ESP wear, i.e., reduced equipment run life.
Figuring out whether the root cause of production dropping to zero is slugging, pumphead degradation, or both, is necessary to select the appropriate remediation for the well. While identifying the cause can be difficult with our understanding of the physics, we have the tools, i.e., the correct diagnostic plots, to identify the root causes even when several factors are at play. At the risk of oversimplification, in most cases, slugging shows the symptom of a wave, with a regular period and amplitude, although several waves may coexist. Whereas head degradation is quasi-steady state. The prize, of course, is to reduce or delay the onset of no-flow occurrences to keep production flowing and prevent damage to the pump, and that’s possible through a couple of different approaches.
From Lab to Field
As a practicing field production engineer, my research focused on how to use the understanding of the physics provided by academia to develop diagnostic tools which could be used with the real-time data available from both the downhole ESP gauge and the variable speed drive, i.e., without the need to add any special metering.
We needed a pragmatic analytical approach that respected the physics and could be applied to most ESP wells.
This quest is my learning journey, and I have stamped the key milestones by authoring a number of SPE publications, starting in 2011 with SPE 141668 regarding the measurement of in-situ pumphead degradation. In 2018, I investigated the application of constant current mode and “gas-lock” ride-through to increase ESP uptime (SPE 190940). I subsequently discussed the difference between slugging and head degradation in 2020 in SPE 201476, which then led to the most recent paper which focuses on unconventionals. Along the way, there have been other papers discussing ESP gas handling with field case studies, such as SPE 127593 and IPTC 19852, as well as a webinar, which is hosted on the SPE website.
As a “servant” to data and physics, I consider myself fortunate to have had exposure to both real-time data and an understanding of the physics provided by academia.
The common thread throughout my published case studies has been that diagnostics can be physics-based and analytical if conducted holistically. The key is to model the ESP interaction with both the wellbore and the reservoir. The first needs an understanding of how and when wellbore slugging causes ESP transient rates and zero-flow events, whereas the reservoir interaction requires rate transient analysis (RTA) to capture the impact of the decline in reservoir pressure and productivity index (PI) on ESP production, which is changing continuously in an unconventional. Eventually, the decline is so large that the ESP can no longer deliver the required pressure, and a workover is required to install a new ESP or another form of artificial lift. Optimization lies in predicting and delaying that inexorable moment (see Case 3 below).
In this latest paper, I carefully selected two case studies where slugging and head degradation occur separately, thereby simplifying the explanation of the diagnostics and remedial action. In the first, the main cause is slugging and, initially, head degradation does not contribute to zero-flow events. In the second, head degradation dominates the data signature, and slugging is only observed during late time due to decline. A third case study is also presented to show the evolution of the well through both causes, which eventually coexist and compound the challenge. The interaction of the ESP with the reservoir is also explained in this third case with a simulation of how the decline in reservoir pressure and PI impacts production and workover decision-making.
Case 1: Slugging
The first case regards how an ESP reacts to wellbore slugging, especially when operating at rates less than best efficiency point (BEP), which is representative of the interaction between the ESP and the wellbore. As slugging is caused by the flow regime in the horizontal lateral and/or the production tubing, it is important to bear in mind that the ESP reacts to the density and pressure variations and is not itself the cause of slugging.
The ESP can be compared to a buoy bobbing in waves, which has no choice but to go up and down because its mass is small in relative size to the waves. Wellbore slugging is also a wave of pressure and density fluctuations, with a period and an amplitude that can be identified in the real-time data. One can observe the ESP reaction in both the ESP discharge pressure and current, with the key measurement being the induced ESP transient rate. These three parameters also fluctuate periodically in reaction to the wave of slugs. Interestingly, the intake pressure usually exhibits negligible fluctuations and is ill-suited to monitor the impact of slugging.
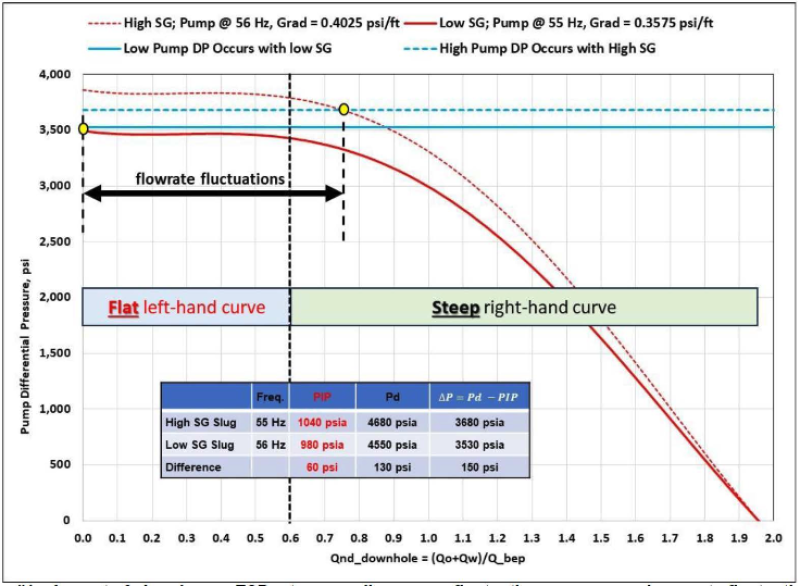
The data for the first case study spanned 7,300 hours (304 days). After 3,700 hours of production, depletion resulted in an average ESP rate of less than 60% of BEP and large fluctuations in transient ESP rate were observed, which included numerous zero-flow events. For this particular pump model, operation below 60% of BEP was associated with a “flat” head vs. flow zone of the pump curve, which is also commonly referred to as a low head-rise to shut-in. This is a characteristic of the pump curve shape, which is best defined by the derivative of the head with respect to flow. The amplitude of the ESP transient rates is inversely proportional to this derivative. When the derivative is high, i.e., the curve has a “steep” slope, the pump transient rates are small. Conversely, when the derivative is small, the head-flow curve is “flat,” and the ESP transient rates are large even when the pressure and density fluctuations caused by wellbore slugging are small (Fig. 3).
Fig. 3—How the pump curve shape impacts the reaction to wellbore slugging.
Source: SPE 219556.
This is an interesting dataset because both motor and annulus temperatures rise despite a constant current, which corroborates the repeated zero-flow events. Another noteworthy observation is that temperature is a lagging indicator, whereas pressure and ESP transient rates are leading indicators, which are therefore important inputs for proactive surveillance in unconventionals. Overall, the well in this case history suffered from a classic case of operating in the “flat zone” in the presence of wellbore slugging, which generates numerous low-flow events and reduces drawdown and production. Depletion was the cause for the decline in rate, which led to the pump operating at an average rate of less than 60% of BEP and experiencing repeated no-flow events. However, adding extra stages would delay the inevitable and improve the run life. Moreover, an improved solution would be to combine extra stages with a pump that features a “steadily rising head-flow curve,” i.e., eliminate the “flat zone” which would maximize run life and drawdown.
Case 2: Pumphead Degradation
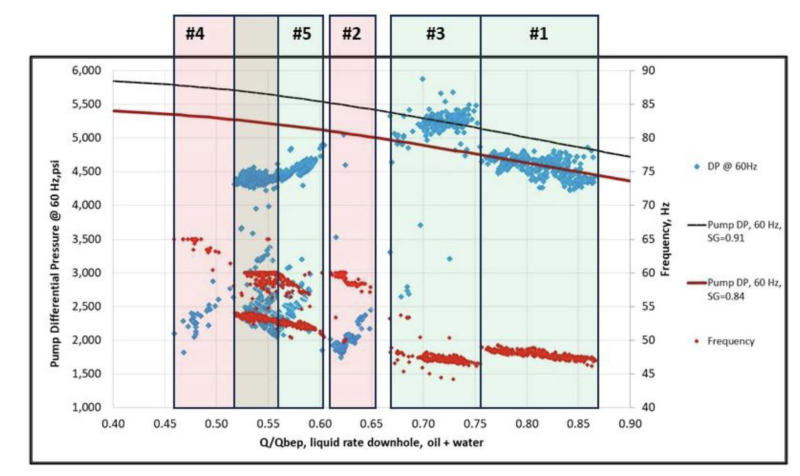
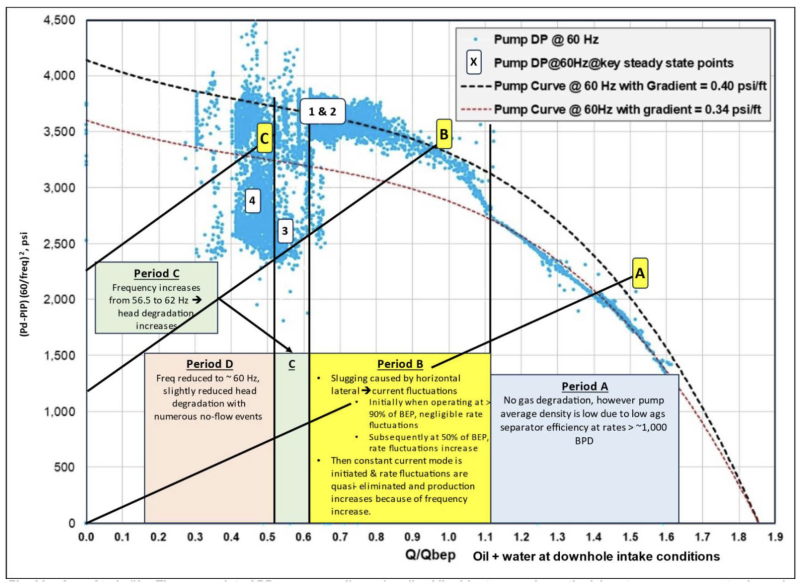
The second case study illustrates that it’s not just free gas affecting pumphead degradation, but also the liquid rate as a percentage of the BEP. The symptoms of this scenario are counterintuitive because the pump differential pressure reduces when the frequency is increased, which is contrary to centrifugal pump affinity laws. It is not a transient phenomenon and is a repeatable steady-state response, which lasted 9 days the first time and then later for 26 days. This meant that while equilibrium had been reached, there were different forces at play. Dropping discharge pressure when pump speed was increased turned out to be the first indicator, but it took plotting the data for five different periods to dissect the problem and confirm the diagnostic (Fig. 4).
Fig. 4—Diagnostic plot to identify head degradation when operating below 65% of BEP for this pump model.
Source: SPE 219556.
During the two periods with a rate greater than BEP, the measured differential pressure matched the predicted pump curve differential pressure. However, when the rate was below 65% of BEP, the pump differential pressure decreased by 20% and 50% below the pump curve. In this case study, we were seeing in the field exactly what the scientists saw in the lab, but without the noise of everything else going on. The most likely cause for the drop in differential pressure is a reduction in the operating point as a percentage of BEP, making it essential to monitor the rate normalized by BEP. The case study confirms a change in pump curve shape below BEP as was shown in the lab by Jose Gamboa (Fig. 2). Remedial actions include monitoring discharge pressure and average downhole rate as a percentage of BEP, especially when increasing frequency. Also, more stages would delay operating below BEP for the same produced rates.
Case 3: All Causes Combined
The third case study considers the evolution of gas interference in an unconventional well, inspecting the interactions of the ESP with the wellbore and the reservoir, and how inflow varies with time and production. There’s so much depletion that you have insufficient lift, severe head degradation, and slugging, all happening at the same time—that’s game over. This is a situation that typically happens at the end of ESP life with operating rates under 20 to 40% of BEP, when one also observes repeated no-flow events. The reservoir monitoring dimension is an interesting diagnostic plot that helps confirm when a workover should be planned (Fig. 5).
Fig. 5—Diagnostic plot combining head degradation and reservoir monitoring to identify when a workover should be planned.
Source: SPE 219556.
As with previous case studies, more stages combined with a steeply rising head-flow curve to shut-in delays the inevitable. Moreover, with a holistic monitoring of both inflow and outflow, this can be predicted analytically with the use of real-time data, which would help operators forecast workovers and the required design of the next artificial lift completion.
Conclusions
The paper’s presented diagnostics would rightly be perceived to be time-consuming and ill-suited to the on-the-fly reactivity required when dealing with hundreds of wells in a field. The challenge is compounded by requiring a multidisciplinary team to cover both ESP data interpretation and unconventional reservoir analysis to capture the impact of depletion.
Despite the apparent complexity, the good news is that a simplified and standardized approach can be implemented in a given geological basin where wells have similar PVT properties and formation depths. This can be achieved by analyzing a representative sample of wells, which become the “type wells,” which both simplifies diagnostics and standardizes ESP designs in the field, thereby enabling industrialization of both diagnostics and decision making.
Analogously, where discharge pressure is normally not available due to casing ID constraints, the sample of wells can exceptionally be fitted with the necessary gauges despite the additional costs as only a few wells are financially impacted. Likewise, daily three-phase surface testing can be implemented for such a one-off exercise, thereby providing excellent datasets for type wells. Moreover, even where data is difficult to analyze because there is a superposition of phenomena, i.e., slugging and head degradation occur simultaneously, we can isolate the causes with “smart” diagnostic plotting and the use of non-dimensionalising ratios.
Performing such “batch” analysis is worth the effort on a few wells as the potential accelerated production and increased ESP run life is substantial, especially if scaled up from the sample wells to fieldwide implementation.
To conclude, as an industry, we have the data, understand the physics, and have the tools required to deliver production optimization, especially if we can deploy pumps with more stages and head-flow curves with a high head rise to shut-in.