Author: Yuri Limberger – Mud Logging Expert
Fractured reservoirs occur in a wide range of stratigraphy of subsurface, at various depths, and in a large range of pressures and temperatures. While the spread of granular type reservoirs (intergranular reservoirs, porous reservoirs) is associated with terrigenous and carbonate rocks only, i.e. with the rocks of specific but limited lithology, the fractured-type reservoirs were detected and have been developed not only the above mentioned rocks but in the rocks so unusual for reservoirs as shales, granites, claystones, etc.
Record-breaking cumulative oil production can be characteristic of such type reservoirs, exceeding the level of one million ton per well sometimes.
The article presented here for reader’s review is a result of author’s multiyear study in attempt to resolve some practical and theoretical issues of identifying and exploring fractured reservoirs in the process of prospecting and exploration of fields and recovering hydrocarbons from them.
These studies include:
- Statement, setting and solution of individual tasks related to the theory of geophysical techniques of subsurface exploration of well columns;
- Computation of geologic and geophysical situation based on obtained theoretic solutions;
- Development of new research methods of studying fractured reservoirs;
- Processing and Interpretation of the results related to using these techniques inside wells;
- Processing, interpretation and generalisation of the data obtained after well testing and development of the fields with oil accumulated in fractured reservoirs;
- Processing and interpretation of the results of special experimental researches;
- Critical re-evaluation of publications issued by other research workers.
Overall, materials of more than 1200 wells over 180 areas and oil fields have been studied with regard to the subject matter under consideration.
The history of exploration and development of certain occurrences was tracked starting from drilling of the first prospecting well and ending with their complete water cut. The fields were located in various geographic, geologic and climatic conditions. The age of the fissured reservoirs ranges from Oligocene through Riphean. The rocks of the reservoirs are composed of sandstones, siltstones, limestones, dolomites, claystones, granites, tuffites, etc. Formation pressure was changing from the abnormally low to extremely high, the temperature range from 25 °С to 185°С. That is, fractured reservoirs have been studied in the whole range of their geologic and technical conditions that are encountered in modern practice.
Fractured Reservoir Structure
Up till now, the greater part of geologists, geoscientists, field developers, both in our country and abroad, have had a concept of a model of a fractured reservoir as a kind of volume of rock, dissected by fractures of different direction, angle of gradient and crack opening (Fig.1).Such a concept has been the result of some visual observations of geologic outcrops and core, delivered to the surface, which does not take any account of the stressed state of the rocks occurring in real conditions. Therefore, first of all, it is necessary to explain the structure of a reservoir, as not having a clear understanding of a research subject, it is impossible to develop methods of its study and analyze those changes taking place in the course of hydrocarbon production.
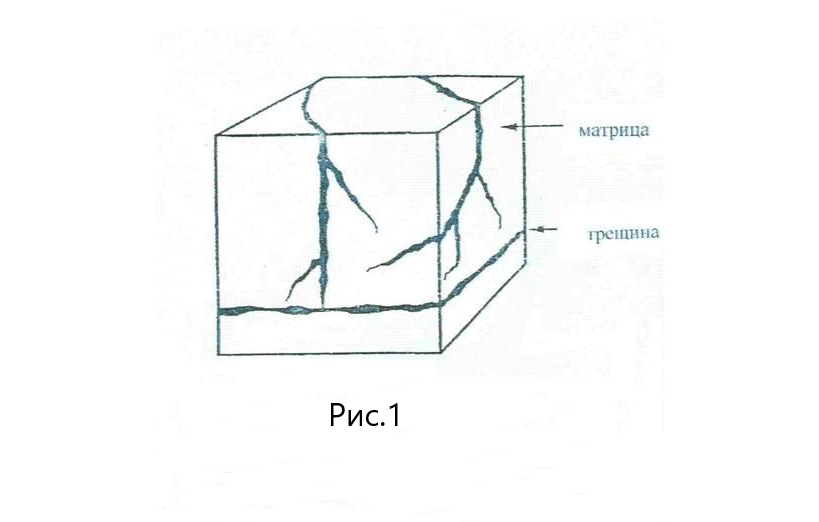
Fig. 1. Widespread Concept of Fractured Reservoir Structure
Judging by a simplest consideration of stresses affecting an element of rock, a working hypothesis was formulated first: for natural conditions of occurrence the probability of vertical fissures is higher than the probability of open horizontal cracks. The hypothesis was tested using three independent approaches: 1) By comparing the results of well completions with the volumes of flush fluid lost in the process of drilling. 2) by comparing the formation of fluid influx with tangential stress present at the walls of a borehole; 3) by studying the depiction of rock outcropping in an oil mine at Yaregskoye field.
Based on the first approach, it was believed that the flush fluid absorbed during drilling would go down along the system of vertical fractures into the water cut part of the occurrence and would not interfere with the recovery of clean oil. And if horizontal fractures are present there, the absorbed fluid would be inevitably recovered together with the reservoir fluid. Analysis of the data was carried out that had been obtained after the completion of 150 wells drilled for fractured reservoirs the drilling of which showed the facts of absorbed flush fluid in the volumes ranging from several hundred cubic meters up to hundreds of thousands of cubic meters (a number of wells were drilled with pumped flush fluid not showing up on the surface at all). The result of the completion of all of those wells was oil not containing any signs of absorbed flush fluid.
Therefore, the first approach has confirmed the hypothesis about dominating role of vertical open fractures in fluid flow in situ.
The second approach took into account the impact of tangential stress σθ arising and active on the walls of a borehole and near it. Under certain conditions which can be created in the process of well stimulation, the tangential stress may exceed the formation pressure Рпл..which would result in closing the walls of vertical fractures, the loss of hydraulic connection between the well and the reservoir, and the lack of fluid influx as an outcome of such test. The closure of horizontal fractures under the influence of tangential stress is impossible; the hydraulic connection between reservoir and borehole would be still there and the fluid would be recovered. Selection of data was carried out after testing more than 100 targets represented by fractured reservoirs, during the stimulation treatment of which the condition σθ>Рпл. was preserved. All of the targets first happened to be “dry”. All of them produced formation fluid after stimulation was done.
The results, obtained using the second, as well as the first, approach, confirmed the hypothesis of a dominating role of open vertical fractures in fluid flow in situ.
Using the third approach, detailed depictions of the Devonian sandstone were studied, which occurs in the depths of 180-250 m, whose oil is produced using shaft method at the Yareganskoye field. Only subvertical open fractures were mentioned in research works of various authors [2; 12].
We should note that these data rebut the already widespread point of view about the possibility for open horizontal fractures to exist at relatively shallow depths.
Therefore, it was proved that only vertical fractures can be open in natural rock conditions (Fig. 2) These fractures form a single network in an occurrence, providing for hydraulic connection between different parts of the occurrence horizontally and vertically. The proven structure of fractured reservoir has the following factors as its basis: unevenness of fracture distribution inside rock massive, inequivalence of fractures of different degree of openness in the process of hydrocarbon production and dominating role of open fractures of subvertical direction.
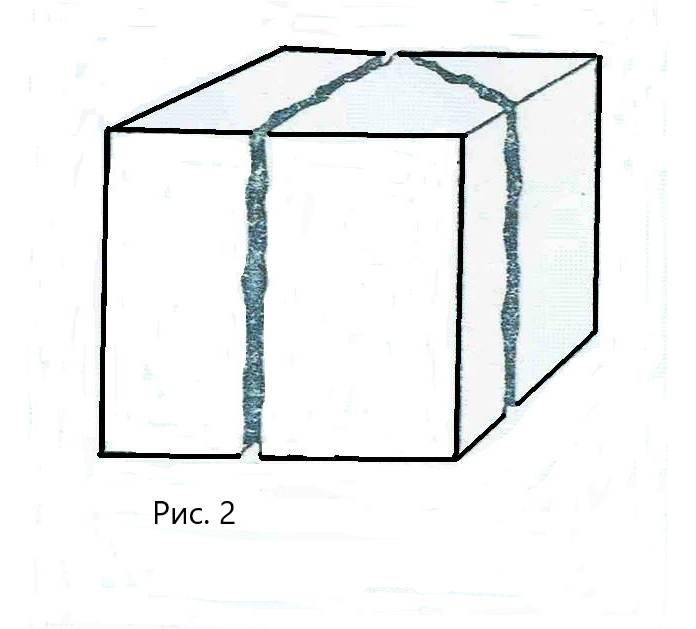
Fig. 2. Real Structure of Fractured Reservoir
Objectives to be achieved at the stage of prospecting and exploration
Embarking on the prospecting and exploration jobs at a new field, one should always keep in mind the probability of drilling-in and drilling over a fractured reservoir. In such case, one shall have to solve a number of tasks which are specific for such kind of reservoir and which are normally not included into the program of studying a cross-section using geophysical and hydrodynamic research techniques. Listed below are some central tasks requiring their solution while studying fractured reservoirs, and the ways of solving them are presented next:
- Identifying open fractures in a well column;
- Assessing the type of reservoir;
- Estimating the extension of open fractures vertically;
- Delineating points of intersection between fractures and well;
- Providing for drawdown pressure to stimulate fluid influx from fractures;
- Estimating fracture capacity.
Methods of identifying open fractures in well columns
A number of methods can be used to fundamentally solve the issue of the presence (or absence) of open fractures in a column of a specific well:
- Recording of fluid loss and gas, water and oil shows in the process of drilling. Fluid loss and/or gas, water and oil shows, recorded in the process of drilling are usually caused by the presence of open fractures intersected with a well. Recording of such complications in the course of normal drilling progress points at presence of fractures in a well column, and it makes it possible to estimate formation pressure and identify the zone of jointing.
- Finding flow potential. A theoretic solution of a problem of electromotive force of flow potential (or potential of self-potential (SP)) in a fracture showed that [9] such electromotive force is 4π times higher than the electromotive force of the potential of capillary percolation (Helmholtz equation)and may bring about extremely high self-potential. By comparing the actual SP anomaly amplitude with nominal static potential one can detect the presence of flow potential which is due to open fracture density [8]. This method is optimal for the use at well columns predominantly composed of terrigenous rocks.
- Comparing propagation velocities of different length waves. If rock matrix structure is homogenous, propagation velocities of short length waves and long length ones are equal between themselves. If rock matrix structure is significantly disturbed with open fractures, the propagation velocity of short length waves would exceed the one of long length waves. Values obtained in the acoustic and seismic range of frequencies (acoustic logging and profile shooting data) were used as velocities of waves of different length. This method is advisable for the use in the depths of rocks with unvarying lithology and considerable depth.
- Comparing horizontal stress with formation pressure. Condition for existence of open vertical fractures shall be formation pressure exceeding horizontal stress σгор (Рпл>σгор). Otherwise open fractures must be missing [6, 13]. Formation pressure is measured using pressure gauge in the process of inflow tests.
Horizontal stress can be determined using two methods: – computation and using the results of hydraulic fracturing of formation. In the first case:
σгор = δср • g • h • ν/(1-ν) (1),
where δср – is average density of subsurface rock from surface to depth h;
ν – is Poisson’s constant; g – is gravity acceleration.
Poisson’s constant is computed based on the measurement of velocities with which longitudinal and transversal waves are propagated according to the known formula, and nowadays it is a routine procedure.
Determination of horizontal stress based on the results of hydraulic fracturing of formation gives us a more accurate value, provided stress concentration factor is taken into account during the recording of the fracturing process.
Otherwise, the minimal horizontal stress would be significantly overestimated. Determination of the minimal σгор value based on the materials of hydraulic fracturing of formation is in details considered in the work [10].
We should note that the method of comparing horizontal stress, determined on the basis of materials of hydraulic fracturing of formation, and formation pressure measured using a subsurface pressure gauge, provides an absolute guarantee for determining presence or absence of open vertical fractures in a well column under consideration.
Determining reservoir type
Determining reservoir type actually confines to evaluation of fluid loss properties of rock matrix. Why is it necessary and important? If rock matrix is permeable, then we have a fractured reservoir with permeable matrix, but in case rock matrix is impermeable, we deal with a purely fractured reservoir.
In the first variant, one can ignore the capacity of the fracture system while estimating reserves since it is incomparably low against the capacity of matrix pore volume and it is within an absolute error if we determine porosity using geophysical methods. In the second variant, it is the capacity of the fracture network that determines the volume of commercial deposit of an occurrence.
Qualitative indicators of rock permeability which are normally used to judge about presence of an intergranular reservoir, are acceptable in this case too. If such permeability indicators are established we deal with a fractured reservoir with permeable matrix. But if we have no clear indication that the rock matrix is permeable, we have a purely fractured reservoir. Clear signs of the rock matrix permeability may be missing when we have certain properties of drilling flush fluid. For such cases, two conceptually new methods of task solving have been rationalized and tested.
The first one is based on detecting tension cracks in the near-wellbore zone, which wildly formed in the process of drilling, and which are extended in radial directions. Such fractures emerge under conditions when flush fluid pressure down the hole is exceeding the combined tangential stress and the rock’s tensile (fracturing) stress. Calculations based on the known theoretic solution of the task about prestressed rock near a well bore, indicate that the radius of wild fracturing zone ( R ) would not exceed 1.2-1.5 of a well radius (Rс),i.e. R/Rс≤ 1,5. If such fractured area is detected, it is an indication that rock matrix is impermeable. Beyond such area the tangential stress works for contraction.
Zones of spontaneously formed cracks are typical of well columns drilled using flush fluid of increased density. There is a record of a continuous extension of such fracturing exceeding 1 km in well columns composed of rocks with different lithology and drilled using flush fluid with density of not less than 1.6 g/cm3.
The second method is based on the mentioned theoretic solution of the task about determining stresses near a vertical well and it is implemented by taking into account the tangential stresses within the areal limits of a well by changing the bottom-hole pressure.
Determination of vertical fractures extension
It is necessary to know the extension of vertical fractures through the section vertically to determine the lower boundary of a fractured reservoir vertically and to estimate hydrocarbon reserves. This can be defined using the above mentioned method of fracture identification by comparing horizontal stress with formation pressure. As long as condition Рпл>σгор is fulfilled, open vertical fractures may exist down to certain depth. When applying this approach it is necessary to estimate the change of horizontal pressure and formation pressure along the depth of a well column under consideration.
The length of fractures in formations of limited thickness is usually confined within formation thickness. This rule is violated in zones of abnormally high formation pressure, where continuous length of open vertical fractures (regardless of their discrete layers) may exceed 1.5 km.
Identifying the fracture-well intersections
This task being resolved is a reliable basis for selecting the right interval for producing formation fluid out of cracks. Points of intersection between a well and open fractures are in fact the spots of the reservoir-borehole hydraulic channel reaching the walls of a well. Hence, we may conclude that the methods of registering the fluid movement over such channels should have vivid priority over other methods. The simplest way is registering fluid losses and/or gas-oil-water shows in the process of drilling: the depth, at which the event is registered, must be as a first approximation, the place where fractures reach the walls of a borehole. Other possible variants are anomaly of high electric conductivity and present streaming potential. To accurately solve this task it is advisable to use new methods, the specific use of which depends on the properties of a flush fluid pumped in a borehole.
If the well is filled with flush fluid capable of electric conductivity, considerable surges in strength of current, coming from the central electrode of the lateral logging device, would be an indicator of open fractures present there.
The strength of current is registered as a separate curve (Fig.3). Theoretical justification of the method is presented in the work [5].
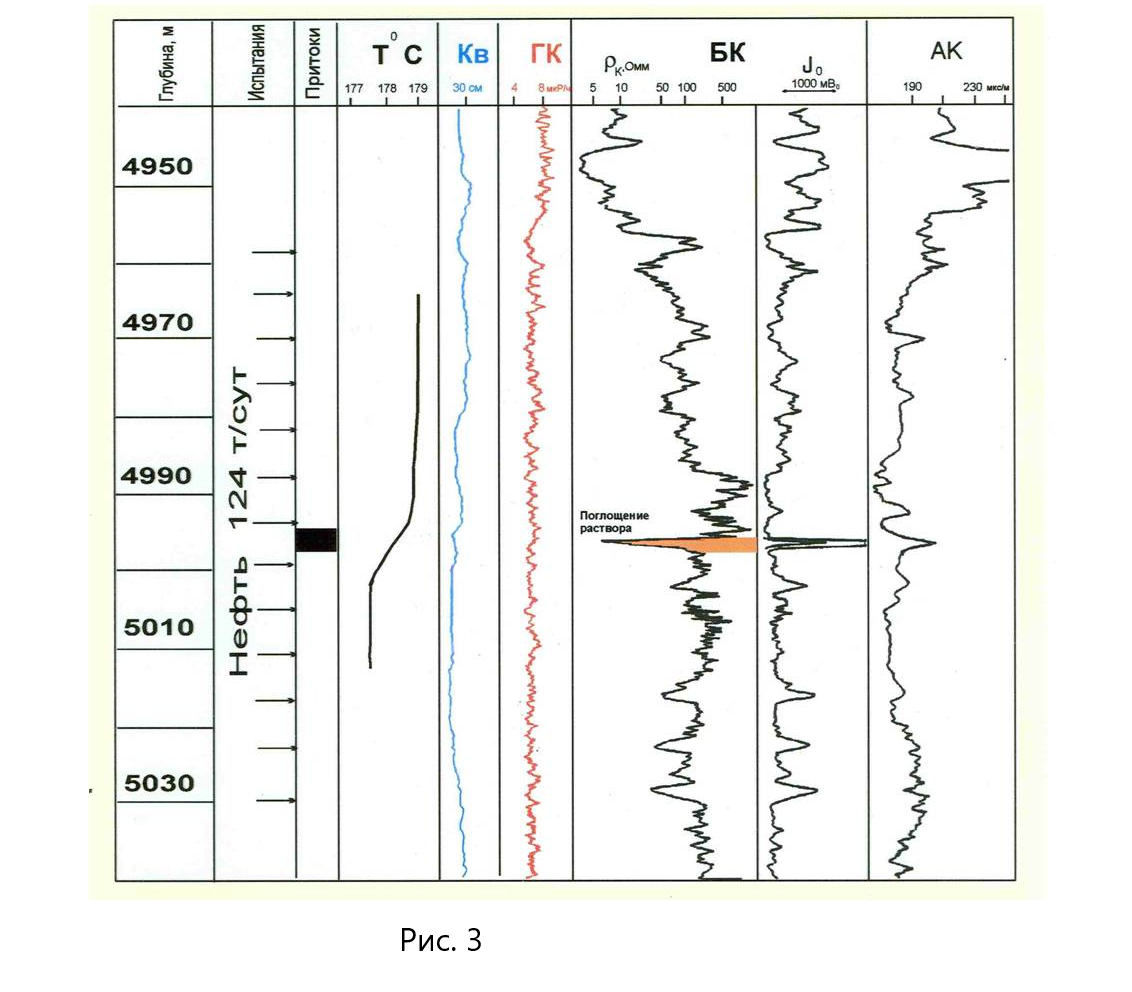
Fig. 3. Delineation of Fractured Zone Using Current Strength Anomaly in Lateral Log-3 (LL3)
If the well is filled with flush fluid incapable of electric conductivity, the induction logging is applied then. The use of the induction logging is in such cases based on the results of solving the direct problem of the induction logging theory for a 3D model of environment with a well and vertical fractures present [3,7]. An indicator of fractures present there would be the anomaly of specific form of the electric conductivity curve (Fig.4).
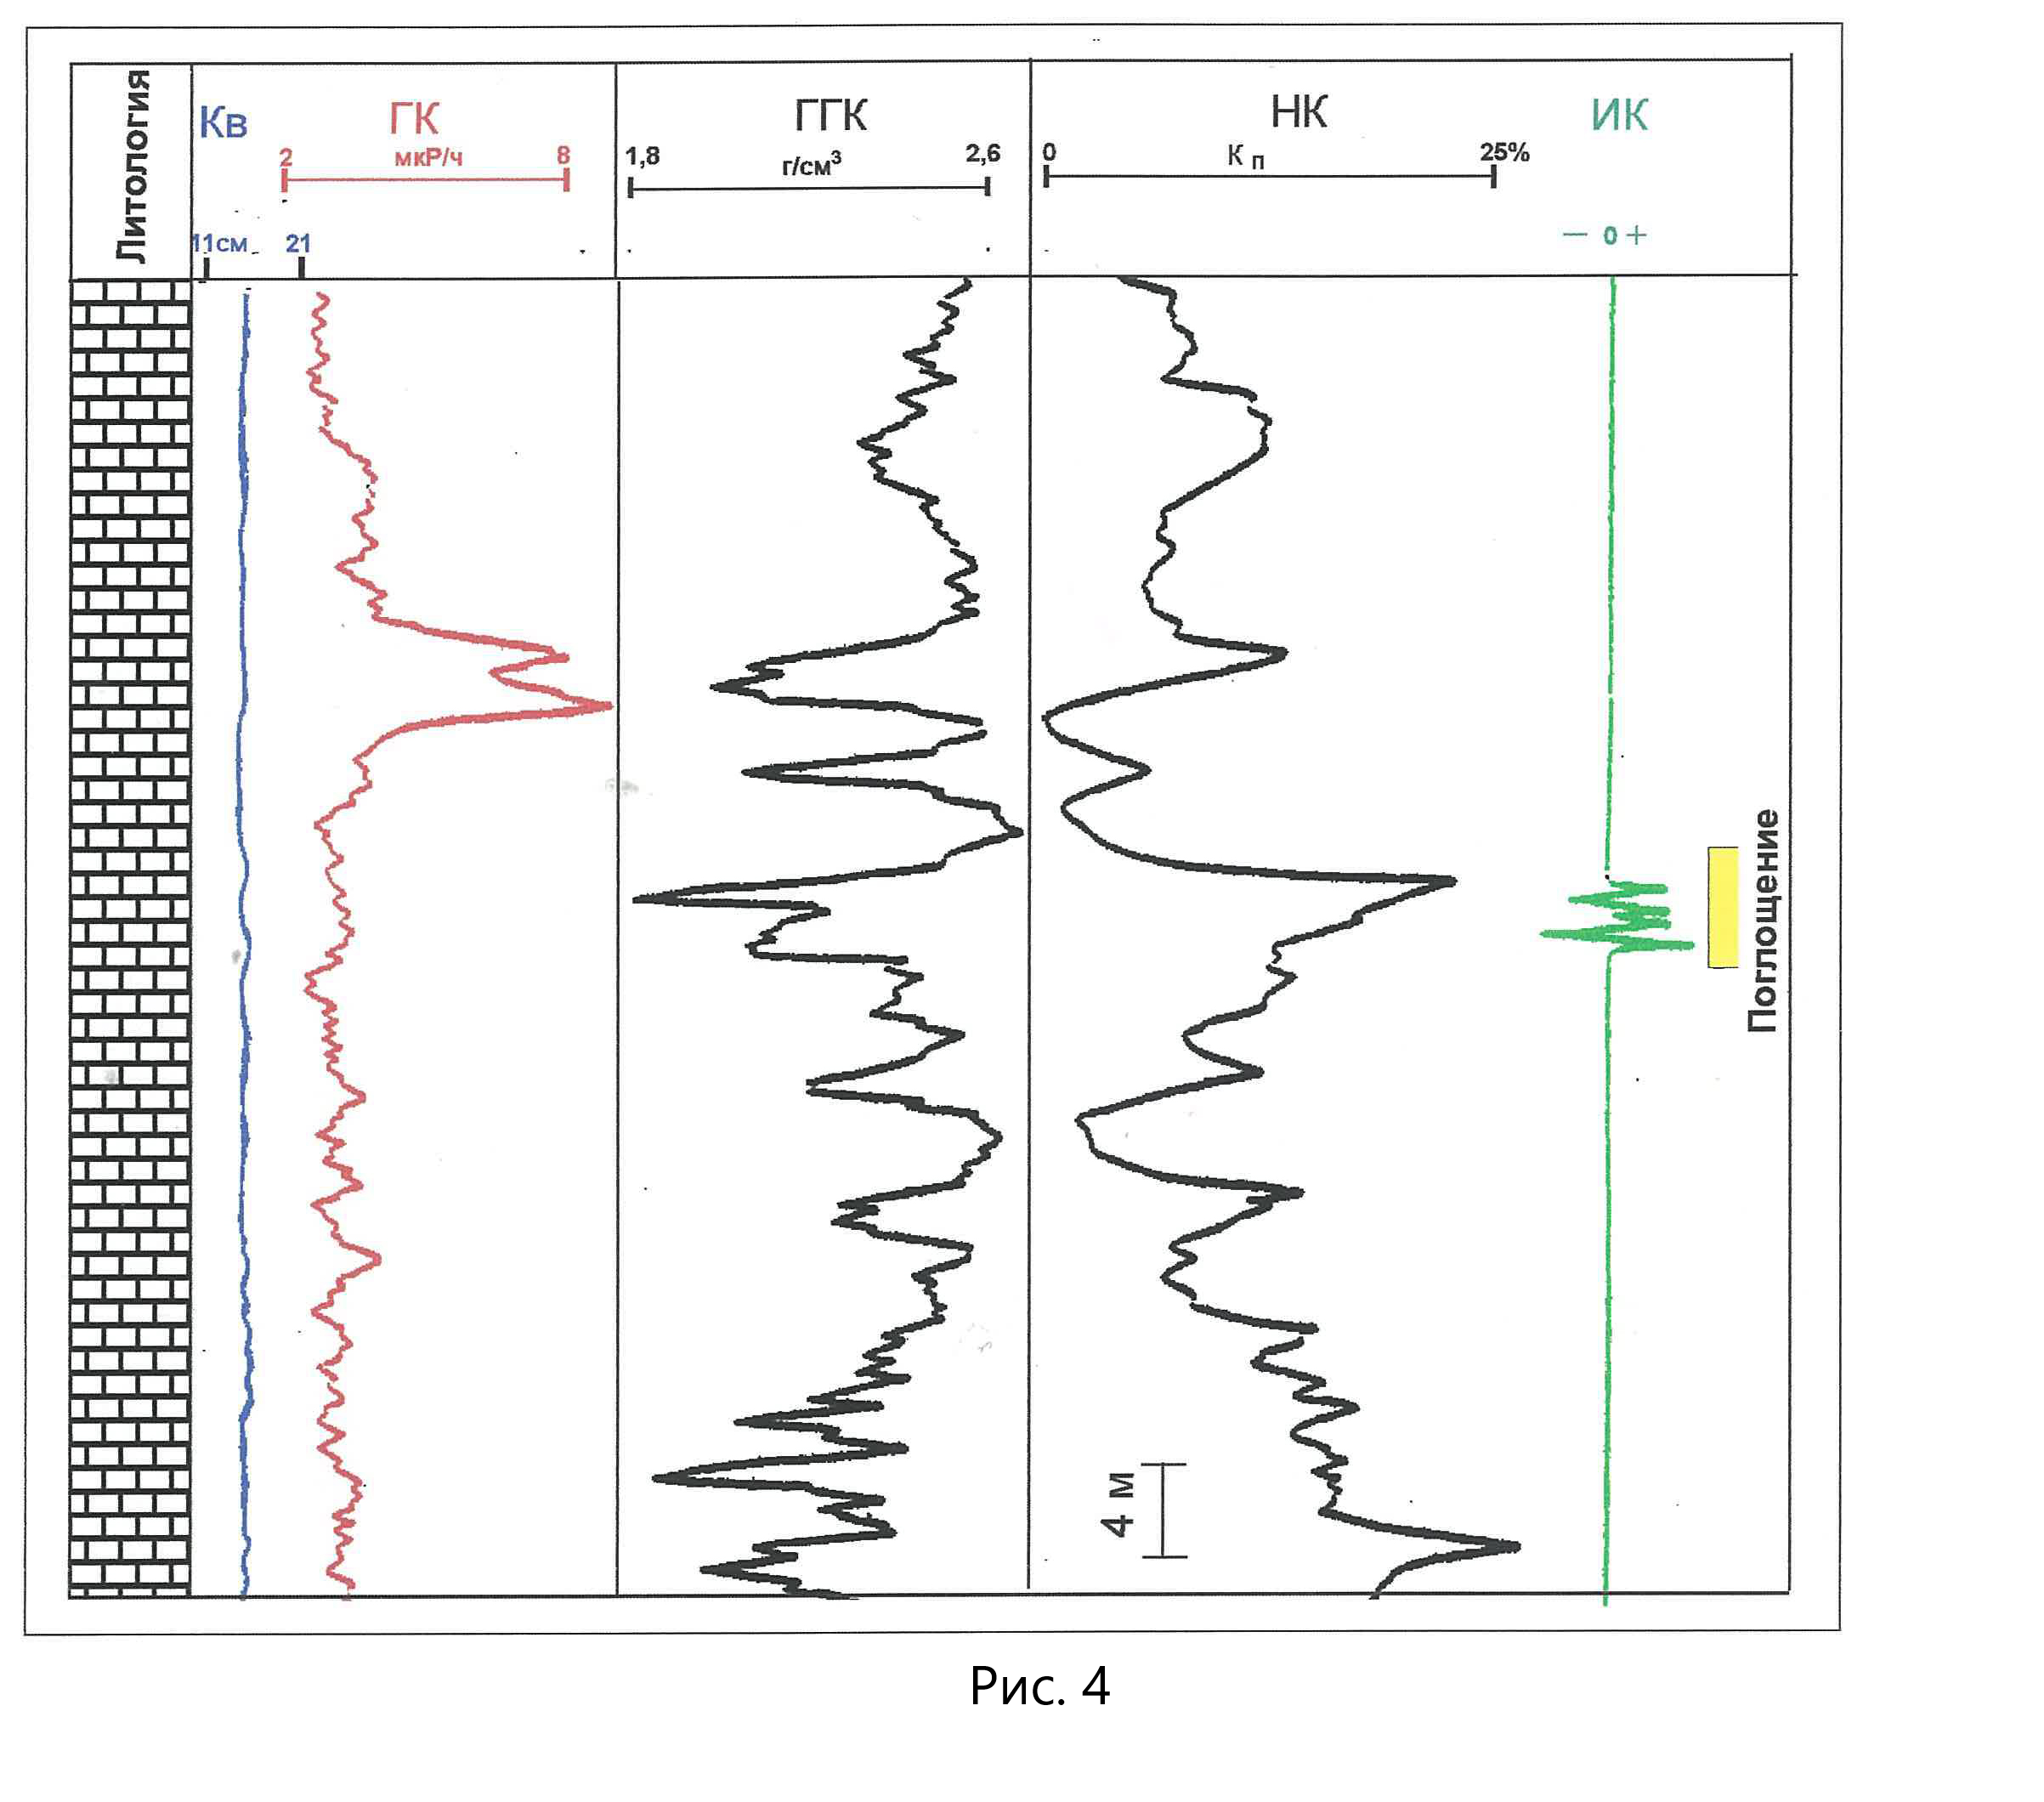
Fig. 4. Delineation of Fractured Zone Using Electrical Conductivity Anomaly of Induction Log
Based on the results of the application of these methods, an examination of the frequency of detection of open fractures in a well column was carried out. The data obtained showed that the distance between two consecutive fractures (fracture zones) ranges between 3 to 84 meters along the well bore.
Additional research was carried out using geophysical survey methods in operating wells producing oil from an open hole through perforated column.
The results of such research showed that oil was coming into an open hole of 150-200 m in length from 1 to 3 cracks distant from each other in not less than 35 m. Distance between active fractures in perforated columns was smaller but at least one of them produced not less than 70% to 90% of oil making up the total production. Taking into account that permeability of a fracture is theoretically proportional to the cube of its openness, the obtained data imply that a wide open fracture provides for a dominant share of oil in the total production rate.
Rationale for drawdown to stimulate inflow
Presently we have no geophysical methods of defining the type of fluid filling in a fracture. Well column testing for inflow has been prevailing as a way to solve this task. Rationale for drawdown serves as a guarantee for obtaining fluid from fractures. Due to the fact that fracture compressibility factor is not less than an order greater than rock pore compressibility, the fracture openness considerably changes along with changing stress on the rock and this predetermines fracture flow capacity. While the condition that formation pressure is greater than bottom hole pressure (Рпл>Рзаб) is necessary and sufficient for stimulation of oil from the pores of intergranular reservoir, the fulfillment of such condition for fractures is quite necessary. While the fulfillment of the second condition i.e – Рпл>σθ will be just sufficient.
Higher fracture compressibility predetermines strong correlation between drawdown and well productivity (Fig. 5). As we can see from the picture, fractures yield only within a definite range of drawdowns, created to stimulate inflow. Exceeding some critical value of drawdown leads to a situation when formation fluid is prevented from coming into a well. To prevent this one should abide by a simple rule formulated on the basis of the results of testing various targets: drawdown for stimulation of inflow from fractures must be as low as practicable under specific subsurface conditions and the testing equipment used for that.
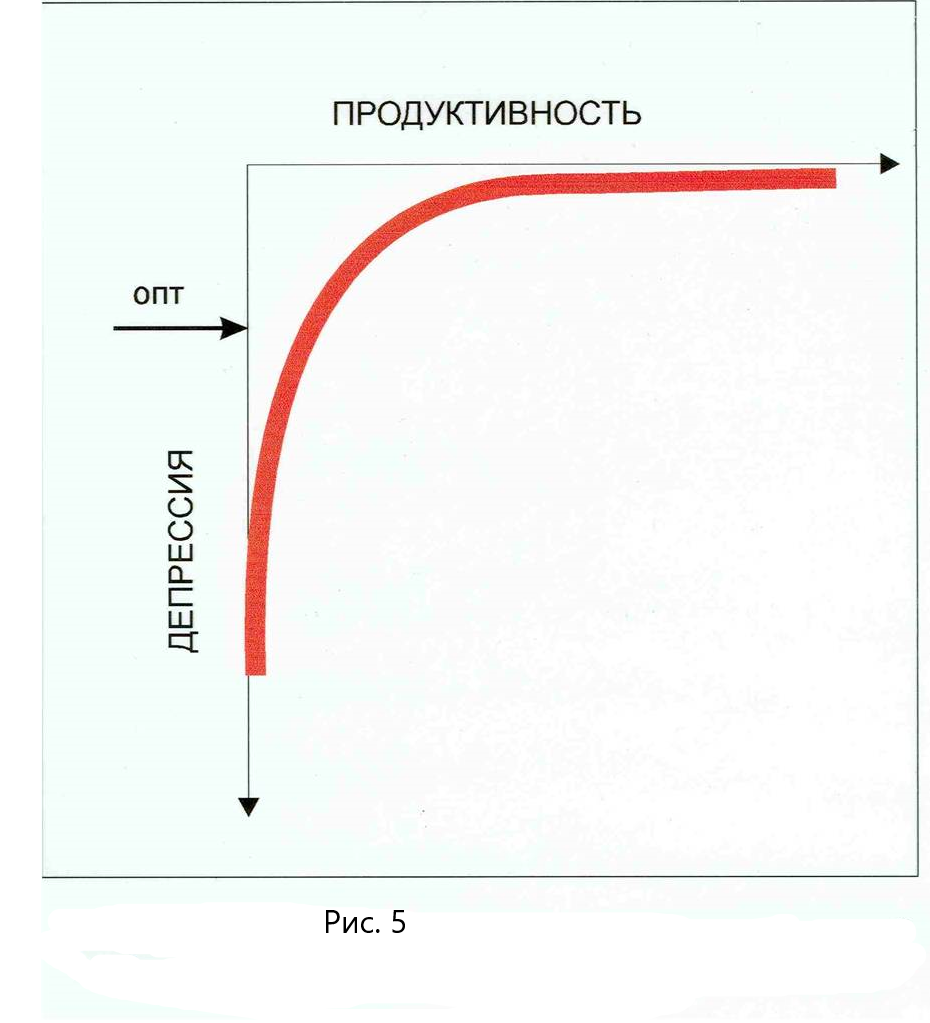
Fig. 5. Master Curve “Drawdown – Productivity“for Fractured Reservoirs, Opt – Optimal Drawdown.
Multiple cases have been known from practice when vivid signs of present fractures were registered in a well column in the course of drilling while no fluid inflow was actually received during the testing of corresponding formation segments. Statistical data from various areas of oil production showed that when the fractured reservoirs were tested using drill stem tester in the process of drilling, not less than 70% of run-in-hole operations resulted in no fluid inflow and the tested targets were indicated as “dry”. Afterwards, when the wells were completed, all of such targets yielded an inflow of formation fluid. Its absence during the primary testing was caused by wrong choice of drawdown, in the effort to achieve its maximum size.
Reserves Estimation Volumetric Method
The major task, the solution of which most of all predetermines hydrocarbon reserves, is the estimation of fracture network capacity (fracture porosity factor Кптр). The first method suggested for determining this factor included finding the difference between total porosity of rock and the matrix porosity. It was believed that neutron logging and density logging define total porosity while the acoustic logging or electric logging can do this for matrix porosity. However, the results of the latter are influenced by fracturing and such approach cannot be a criterion for estimating Кптр.Besides, the absolute error of estimating porosity using geophysical methods exceeds the crack formation factor due to which the geophysical methods are in principle inappropriate for resolving this task.
It was suggested to apply the bracketing technique to estimate the Кптр value. The implementation of this method requires two measurements of apparent resistivity to be done at different times, having two different values of flush fluid resistance. Then, using the formula derived under certain assumptions, we calculate the crack formation factor. The physio-mathematical modeling of the method and comparing the obtained results with the Кптр models has shown the principal unacceptability of the bracketing technique for estimating the crack formation factor.
Some works contain the description of estimating Кптр based on the definition of rock skeleton compressibility, the matrix and fractures. It was recommended to evaluate the compressibility factors using the materials of core analysis, geophysical and hydrodynamic surveys of a cross-section, i.e. by studying rock volumes that are hardly comparable between each other.
One should not also apply the data of estimated crack formation factor in the core and thin sections. This is due to the fact that the fracturing we observe there is a result of rock deformation during its drilling and lifting to the surface.
Thus, any founded methods of estimating the crack formation factor are missing for today. A possible way out of this could be as follows. Using the occurrences with fractured reservoirs that were removed from development, it is possible to carry out a retrace calculation using the Кптр, volumetric method formula, accepting the total cumulative volume of produced hydrocarbons. The results of such calculations have shown that the real capacity of fracture network is considerably lower than the values of Кптр, that are encountered in individual publications.
The above described methods of delineating and surveying fractured reservoirs are advisable for the use during not only prospecting and exploration stages but during the analysis and reinterpretation of materials of previously drilled wells. These methods are characterized with simplicity of their implementation and their accessibility for each company. Tested at different areas and fields, they proved efficiency in resolving set tasks and confirmed the certainty of the fractured reservoirs structure. The results of using the described methods for one of the areas serve as an illustrative example which made it possible, using the results of the analysis of cumulative multi-year materials, to in principle highlight the prospects of oil bearing capacity of a vast area in a new way. [11].
About the theory of fluid movement in fractured reservoirs
Fluid movement in a fractured reservoir takes place via fracture network. Impermeable blocks of matrix are considered in such a reservoir as noddles of matrix solid material, while fractures serve as intergranular space.
Using the analogy drawn between such fractured reservoir and formation with intergranular reservoir, it is assumed that the process of fluid movement in both systems can be described using the same equations; for instance, if we have conditions of laminar flow, the motion equation is derived on the basis of the Darcy law. The starting point of this would be the equation of flow in an insulated crack, the simplest model of which would be a stream in narrow space between two parallel plates.
In case when the matrix rocks are permeable, the theoretic assumptions about the movement of fluids in such fractured reservoir are based on the idea of one medium inserted into another one (“double porosity”, “double cavernosity”), first formulated in the work [1]. It is assumed that the conditions of the flow area are actually a result of permanent transition of certain amount of fluid from the matrix into the fracture network and simultaneous movement of equivalent fluid mass towards the well. The established stream, moving across the double porosity system, is identical to the stream via nonporous fissured rock.
The development of the double porosity concept took place in our country and abroad at a level of theoretic solutions for various models of fractured medium, with different assumptions and solution methods. The published methods of solution have been purely based on the authors’ contemplative notions about the process of fluid flow in a model of medium selected by them and no one of them has presented a proof that his point of view was true [4]. In this regard, the results of the studies of a number of fields whose properties were unusual for fractured reservoirs are of special practical and academic interest.
Oil deposits in limestones of 55-70 m in thickness were discovered in one of the areas, having porosity of 25-30% and matrix permeability of 20-40 mD. According to the results of processing well logging materials, the water saturation factor of these deposits is always equal to 1 Кв (Кв=1).That is, the pore volume is completely filled with formation water. This conclusion is at first sight confirmed with the results of testing targets for inflow: when RIH operations with drill-stem tester were performed in the process of drilling a well, the well would always produce formation water right at the start. However, after hydrochloric acid treatment was carried out, many wells started blowing out with oil and water cut. And the smaller a choke was, the higher oil content was present in the total liquid influx (Table 1).
| Well | Interval | Test Method | Results | Intensification | Results after intensification |
| А | 1 | Formation testing on pipes while drilling | Water – 54 m3 / day | No | |
| А | 1 | Column perforation | Water – 53 m3 / day | Hydrochloric acid treatment | Water + oil, d=5 mm flow rate 88 m3/day (water 74%, oil 26%), d=3 mm flow rate 30 m3/day (water 54%, oil 46%) |
| А | 2 | Formation testing on pipes while drilling | Water –139 m3/day | No | |
| А | 2 | Column perforation | Water –125m3/day | Hydrochloric acid treatment | Water + oil, d=8 mm flow rate 160 m3/day (water 67%, oil 33%), d=5 mm flow rate 108 m3/day (water 48%, oil 52%) |
| B | 1 | Formation testing on pipes while drilling | Water –177m3/day | No | |
| B | 1 | Column perforation | Water | Hydrochloric acid treatment | Water + oil, d=10 mm flow rate 320 m3/day (water 25%, oil 75%), d=8 mm flow rate 240 m3/day (water 19%, oil 81%) d=5 mm flow rate 170 m3/day (water 18%, oil 82%), d=3 mm flow rate 76 m3/day (water 14%, oil 86%) |
Table 1 — Results of object testing during well drilling and after well completion
The reservoirs of the occurences under consideration are actually fractured reservoirs with permeable rock matrix, the latter being filled with water, while oil occupies subvertical fractures.
It was found that excessive pressure established to stimulate inflow was causing shearing stress exceeding formation pressure. In other words, the second indispensable prerequisite of inflow from fractures was not met.
When inflow was stimulated using a drill stem tester in the course of drilling procedures, as well as after some perforation operations, fluid was coming into a well from the matrix rocks. And since matrix was water-saturated the inflow of formation water was obtained each time. Hydrochloric acid treatment made it possible to restore the connection between fractures and the borehole which, in its turn, ensured penetration of the fluid i.e. oil into fractured network. During development of such occurrences none of the wells was producing water cut oil from the very start, and the correlation of water to oil depended in the total flow rate on the operating choke diameter.
The depicted results are interesting by themselves, but they are of special importance for understanding the processes of fluid flow in a fractured reservoir with permeable matrix, as well as for understanding of hydrocarbon accumulation.
Nevertheless it is coming. The data of Table 1 suggest that even after fractures are closed, the filtration of fluid towards a well takes place using voids. Therefore, the concept of the fracture network being fed by the matrix rocks has no proper foundation. Besides, permeability of fractures in reservoirs with double porosity is not less than by an order higher than the permeability of pores and the velocity of fluid moving through the pores of matrix would not support a steady flow into fractures. The suggestion that pressure drop in fractures is faster than the pressure drop in the matrix, which provides the possibility of fluid flow from the matrix into fractures, is a purely theoretic assumption of the process of pressure fluctuation in this kind of occurrences.
The above said is illustrative of the fact that regarding fractured reservoirs with permeable matrix, each medium, i.e. matrix rocks and fracture network, individually provide for the influx into the well of the fluids separately contained in those mediums. When an occurrence is developed for a durative time, the recharge of fractured network due to the matrix rocks is possibly taking place (merely theoretic assumption) in some amount due to breaking of matrix rocks after it undergoes some ultimate deformation.
Many researchers suggest the solution of the task of fluid flow, both for the first and the second variant of the structure of fractured reservoir for a model selected by them. But regardless of a variant, the model schematizing fluid flow towards a well suggests radial flow in a formation from the outer boundary of drainage area to a well borehole. Corresponding models are known in the literature by the names of their and authors and are in detail considered in the work [4].
We should note that all of the analyzed models of fractured reservoir suggest the existence of horizontal fractures which does not correspond to its real structure. Besides, fluid movement along fractures in merely horizontal direction is ruled out, since the differential pressure vertically is significantly higher than the differential pressure within the radial flow.
Hydrocarbon accumulation
The hypothesis of hydrocarbon accumulation suggests that hydrocarbons, in dispersed form migrate from the places of their formation through rock masses and accumulate in the form of occurrences. Flow inside occurrences means floating up through water, driving water from pores and its displacement by hydrocarbons. The above described oil occurrences in fractured reservoirs with permeable matrix are as such related to the initial stage of their formation. The rock matrix is filled with water across the whole of its width, and oil fills in the already open fractures across the width as well. If we take into account that permeability of fractures is considerably higher than permeability of the matrix rocks the following conclusion suggests itself: it is just subvertical fractures that are the ways of migration for hydrocarbons providing their invasion into an occurrence.
Hydraulic connection deterioration
Based on the analysis of the results of test surveys it was determined at which stage of well construction the deterioration of the hydraulic connection between fractures and borehole takes place. For this purpose, the targets were selected that had identical lithological composition, geophysical characteristics of rocks and test conditions. For some wells, testing was done in the process of drilling using drill stem tester both with preliminary hydrochloric acid treatment and without it.The volumes of the formation fluid inflow from the targets with preliminary hydrochloric acid treatment were not less than in an order (13 to 40 times) exceeding the inflow volumes from the targets not exposed to hydrochloric treatment. Taking into account the fact that drill stem testing was carried out in the open hole immediately after penetrating targets with a drill bit the only conclusion suggests itself: the hydraulic connection between fractures and a well deteriorates right from the moment of drilling in a fractured reservoir and its contact with flush fluid. The probability of rapid deterioration of this connection is higher and higher as the density of flush fluid grows in the process of its use while drilling. Significant difference in the volumes of fluid inflow is determined with hydrochloric acid treatment operation only..
Well Bottom Structure
Based on the above presented results, the selection of well bottom structure is of high importance. Due to this, the issue was studied how well completion method may make an impact on the efficiency of target development in fractured reservoirs and on productivity. The data related to three structures were analyzed: open hole, liner with screen, production casing with cementing and consequent perforation. Open hole completion of wells was not given provision in reservoir development plans. This well bottom structure was usually used when it was impossible to run casing in-hole due to loss of flush fluid in the process of drilling, sometimes having catastrophic consequences. Nevertheless, the completion of targets with open hole was carried out without any problems.
Even there where for the purposes of lost circulation control special filler (rubber crumb, wood scrap etc) was used and borehole was cemented with consequent drilling, bentonite stoppers were injected. Further on, oil inflow was obtained in the course of well completion right away after creating a required pressure drawdown. Oil production from open hole wells is characterized with low pressure drops, high productivity factors, long production periods. The latter speaks for the fact that sustained stress of the rocks in the well columns under consideration ensures the stability of borehole in the conditions of its occurrences.
For wells completed using liner with screen the following was observed. In those cases when cementing was not carried out on the section of the liner above the screen, target development did not have any problems. Such targets are characterized with the same advantages that have been described for the above mentioned structure of well bottom. In those cases when cementing was done on the part of the liner above screen target development often required additional time investment and materials. The situation is determined by the fact that technical devices used during cementing operation did not guarantee that cement slurries would not get into the zone of a screen. This resulted in colmatation of fractures and clogging of screen pipe openings. Any following manipulations were useless in attempts to purge the screen and fractures. As a result, the hydraulic connection between fractures and well deteriorated: oil production was carried out with high pressure drop and low efficiency.
As an example, we can bring the results of completing two wells of one and the same area. The developed target was composed of limestones. Threefold hydrochloric acid treatment was required to complete the well where cementing operation was carried out on the section of liner above the screen. In spite of such intensification of the target, the established pressure drop was equal to 35Mpa, productivity was 0.8 ton/day*MP. As for the other well, without cementing operation above, flush flow of oil was achieved right after the replacement of weighty drilling fluid with water. Pressure drop did not exceed 2 MPa, productivity was 130 ton/day*MPa.
Completion of wells with production casing run in hole, its cementing and the following perforation was identical, as a rule, to completion of wells with run-in-hole ready screen and cementing of the liner done above the screen. Such wells required additional investment of time and materials (up to 5 hydrochloric acid treatments were carried out sometimes for reliable restoration of hydraulic connection between fractures and borehole). Hydrochloric acid treatments have been efficient to restore the connection between fractures and borehole in cross-sections predominantly composed of lime stones.
Hence, the maximum productivity of oil production from fractured reservoirs can be achieved during their open hole completion or ready screen without cementing.
Pressure drops
Pressure drops of developed targets were determined as difference between measured formation pressure and bottom hole pressure for certain choke diameter. It was found that pressure drops vary in a wide range of values when occurrences with fractured reservoirs are developed – from values close to zero up to several dozens of MPa’s . Detailed analysis of data from multiple wells made it possible to make the following conclusion. The bulk of the targets have been developed with drawdown values not exceeding 2-2.5 MPa. Drawdowns over 5 MPa were characteristic of the targets that had not been exposed to intensifying treatment or when it was very low in efficiency.
Dynamics of pressure drops was carried out across time. It was found that drawdowns established at the initial period of oil production for durative time remained the same although the formation pressure was decreasing in occurrences by 4 to 35 MPa relative their initial pressure. As product water cut was increasing, the choke diameter was reduced, which automatically resulted in lower drawdown.
Impact of acid treatments
While a target is developed its rocks are often treated with hydrochloric acid. In quality terms, the impact of hydrochloric acid on carbonate rocks is as follows: hydraulic connection between fractures and borehole (where such connection significantly deteriorated or completely ceased in the process of drilling and cementing a string); hydrodynamic characteristics of reservoirs improve relative their characteristics prior to hydrochloric acid treatment. In terms of quantity, hydrochloric acid treatment results in increased bottom hole pressure (drawdown decrease) and flow rate. As a consequence, the productivity index, as well as hydroconductivity and permeability, are noted to be increasing.
Examples from the practice of the development of certain targets:
- During the development of a target in the interval 5612-5674m no inflow was achieved at first; intake of water was registered under pressure equal to 34 MPa; oil free flow was achieved after hydrochloric acid treatment was carried out.
- With the target developed in the interval 3640-3672 m no inflow was registered at first; water intake was registered with pressure of 20MPa. The first hydrochloric acid treatment resulted in water spill out with flow rate of 4m3/day; oil flow with water cut followed the second hydrochloric acid treatment under bottom hole pressure of Рзаб = 25MPa; the third acid treatment resulted in a gush of oil with flow rate of 100 ton/day under Рзаб = 30 MPa.
- Target in the interval 2660-2681 m. After hydrochloric acid treatment operation was done, hydroconductivity and permeability increased 3.7 times relative their values prior to the hydraulic acid treatment operation.
From the examples above and other multiple examples it is obvious that hydrochloric acid treatment of fractured carbonate reservoirs is highly efficient.
To evaluate the impact of lithological composition of rocks on the efficiency of acid treatment jobs a comparative analysis was carried out with regard to terrigenous and carbonate sediments. Deposits of lithologic and stratigraphic rock assemblages were selected where targets had been developed without any fundamental differences in technology of drilling and stimulation.
For all the areas where simultaneous development of deposits with fractured reservoirs had place, which were composed of carbonate and terrigenous rocks, it was found that pressure drops in the wells producing oil from sandy and clay rocks were 4 to 5 times higher than those in the wells producing oil from carbonate rocks. This difference in the pressure drop values is determined by extremely low effect of hydrochloric acid treatment on sandy and clay rocks. Other acid treatment blends were used, with the view to improve the hydraulic connection between well and fractures, the impact of which on the terrigenous deposits had no positive results.
Hydraulic fracturing treatment has been the most resultative way to restore and improve the hydraulic connection between fractures and well in terrigenous rocks. One should only take into account that hydraulic fracturing of rocks in a fractured reservoir with impermeable matrix is in the end a way to connect fractures of hydrofrac with the network of natural open fractures of a deposit, while in case of a fractured reservoir with permeable matrix the fracture of hydraulic frac serves as a way to increase the area of the surface where screening of formation fluid takes place.
Rock Matrix Deformations and their influence on the development of deposits
Prior to bringing the occurence into development and oil production commencement, initial fracture opening was established in the fractured reservoir which has been determined by excess formation pressure over horizontal stress (Рпл>σгор). The difference between Рпл и σгор shall also decrease from the moment of production commencement which would result in rock matrix deformation i.e. change in their linear size, volume or shape. The character and level of deformations depend on the type and size of applied stresses, as well as on elastic and plastic properties of rock (Fig. 6). Stress increase causes increased deformations and in the end destruction takes place – rock loses its continuity and splits into parts. Generally, three zones of deformation can be seen due to increased stress (Fig.6) – elastic (ОВ, ОВ1), plastic (В1С,ОС1), and breaking deformations (to the right of В,С,С1).
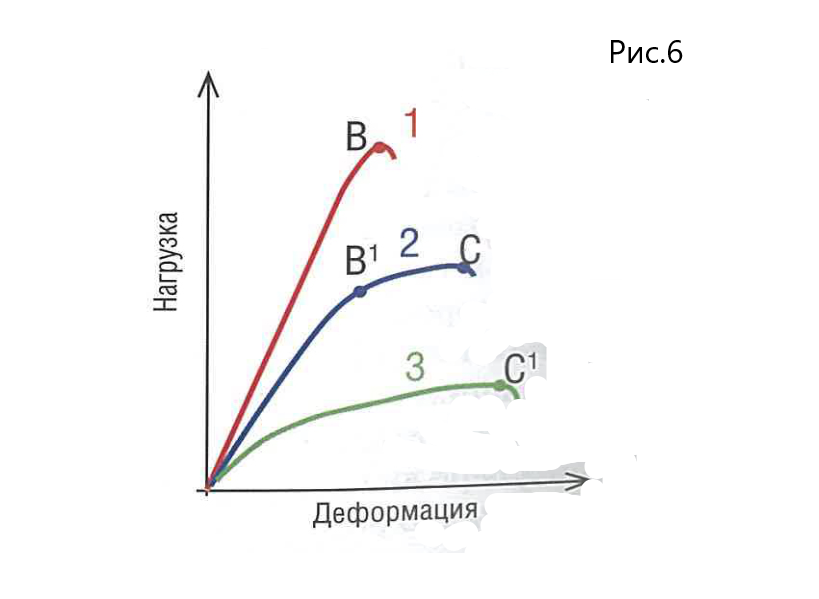
Fig. 6. Typical Diagrams of Deformation in Fragile Elastic (1) , Fragile Plastic (2), Plas-tic (3) rocks where В,В1 are limits of elasticity; С,С1 are limits of plasticity.
Matrix rock deformation takes place from the moment when formation pressure starts decreasing, that being said, the maximum deformation would be towards the least resistance i.e. inward fractures. This would result in reducing the initial openness of fractures. Elastic deformation of the matrix would last till a flexibility limit is achieved. Depending on the rock properties, either fragile breaking would take place or rock would pass into the area of plastic deformation with its consequent breaking. Both in the first and in the second variant, the rock breaking would be accompanied by formation of new cracks in the rock mass. The maximum underbalance falls on the near well-bore area, therefore rock deformation starts near walls of a well with gradual expansion from the well-bore inward the rock mass. Increasing number of production wells and further formation pressure decline in the process of oil production would stimulate deformations and take ever-growing volume of rocks. The deformation processes taking place during oil development and production in rocks of a deposits having fractured reservoirs impact on wells performance and their survey results.
The openness of fractures decreases at the stages of the elastic and plastic deformations, which results in reduction of their permeability and well productivity. Any following breaking of rocks and formation of new fractures determines productivity growth. Such processes repeat themselves in cycles, and if corresponding well surveys take place in wells on a regular basis, they can be registered and presented in the form of an IPR curve and its temporal changes, reflecting changes in well productivity, changes in bottom hole pressure, in the results of pressure interference test.
Below are the examples of the impact deformation processes provide for the results of wells surveyed in various areas:
- The well has a developed target of fractured limestones, its productivity index reduced from 1.7 ton/day*atm to 0.9 ton/day*atm during the period of 16 months from the moment of its bringing into development (Fig.7). After a hydraulic acid treatment, it increased up to 23 ton/day*atm and fluctuated for consequent 8 years in the range of 5.6 – 49.4 ton/day*atm. During this period, formation pressure gradually decreased by 170 atm and nothing was undertaken to increase it. Pressure drop remained steady at the level of 3 to 4 atm for the whole period of observations after hydraulic acid treatment with the choke of 8mm was done. Decreased productivity reflects the areas of elastic and plastic deformation of rocks, while productivity growth is characteristic of matrix destruction and formation of new fractures.
- A rare case was registered in a well having a developed target in the thickness composed of fractured sandstones and siltstones. Well productivity index increased 5.3 times with a choke of 7mm in diameter in the process of a 10 day flowing test.
The increased productivity is determined by elastic and plastic deformations reaching their limits directly in the process of well flow tests. This resulted in destruction of the near well-bore zone, in formation of new cracks and, consequently, in increased productivity. For this well, change in productivity index across time, with choke of 5 mm in diameter, was similar to change in productivity index presented in Fig. 7.
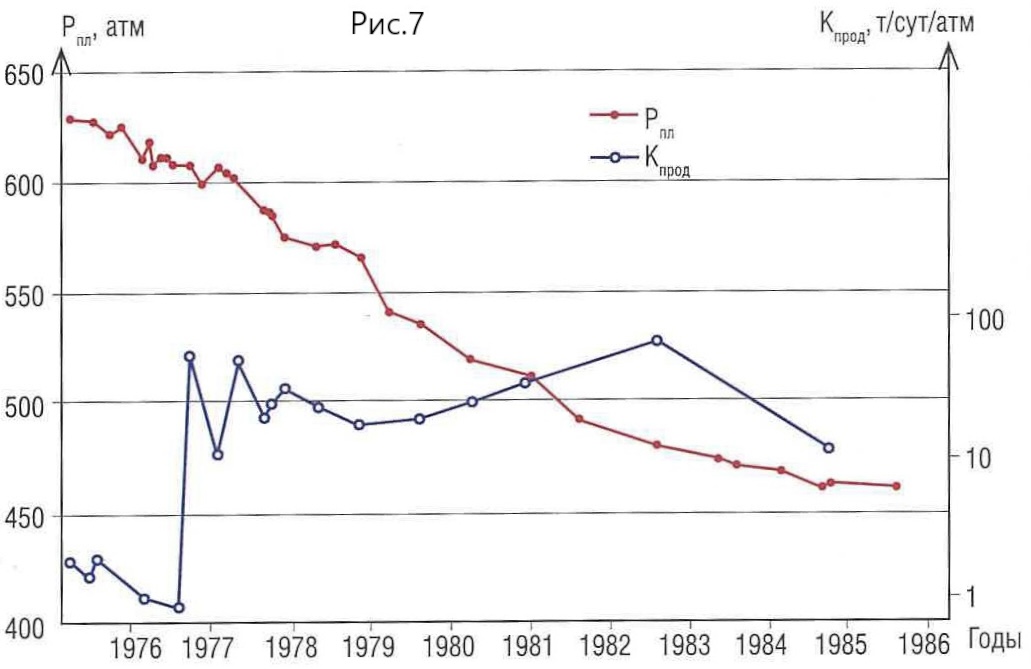
Fig. 7. Dynamics of Formation Pressure and Productivity Index for a Well Operating a Fractured Reservoir
- Fig. 8 illustrates IPR curves and the dynamics of their change across time, over the target composed of fractured terrigenous rocks and metamorphised shales. The well was drilled and completed in 1967. Small drawdowns with high flow rates and straight-line IPR curve indicate well-purged fractures and steady productivity index with chokes of different diameters. Due to green field status of the field the well was in conservation before 1994. The following full-scale flow tests were carried out in 1999. Stages of elastic-and-plastic deformation and matrix rock breaking repeatedly cycled in the occurrence during the period of 1994-1999. In January 1999, the IRP curve shifted toward the left of the initial position and curves toward the axis of flow rates. Reduction of bottom-hole pressure with greater choke diameters increases rock contraction under growing tangential force and the IPR curve would have been more logical to observe toward the drawdown axis. In this case, the stage of rock breaking takes place in the well feed area, with formation of new fractures, which is intensified by the tangential stress and creation of additional fractures directly in the process of well survey. Flow tests in 2 months showed the IPR curve shift toward the right and upward which indicates the process of new cracks formation (i.e. the process of rock breaking) having effect on well performance, was prevailing in the rock mass since then. As the surveys were carried out, switching over to choke of d=6mm caused the IPR curving toward the axis of drawdowns and decreased productivity, which was determined by the impact of growing tangential stress as the process of elastic rock deformation was taking place. A single measurement with a choke of d=4mm carried out next month showed some growth in productivity and the dominant impact of the new crack formation process. The IPR of late 1999 indicates the reduction of productivity. Following April 1999, the process of rock breaking and formation of new cracks came to its end and a new stage of elastic-and-plastic deformation began, which resulted in reduced fracture opening and their permeability. Straight-line form of the ID reflects temporary equilibrium between reduced fracture opening and their increased concentration in the volume unit of rocks. Formation pressure of the occurrence was gradually decreasing and no measure were undertaken to increase it.
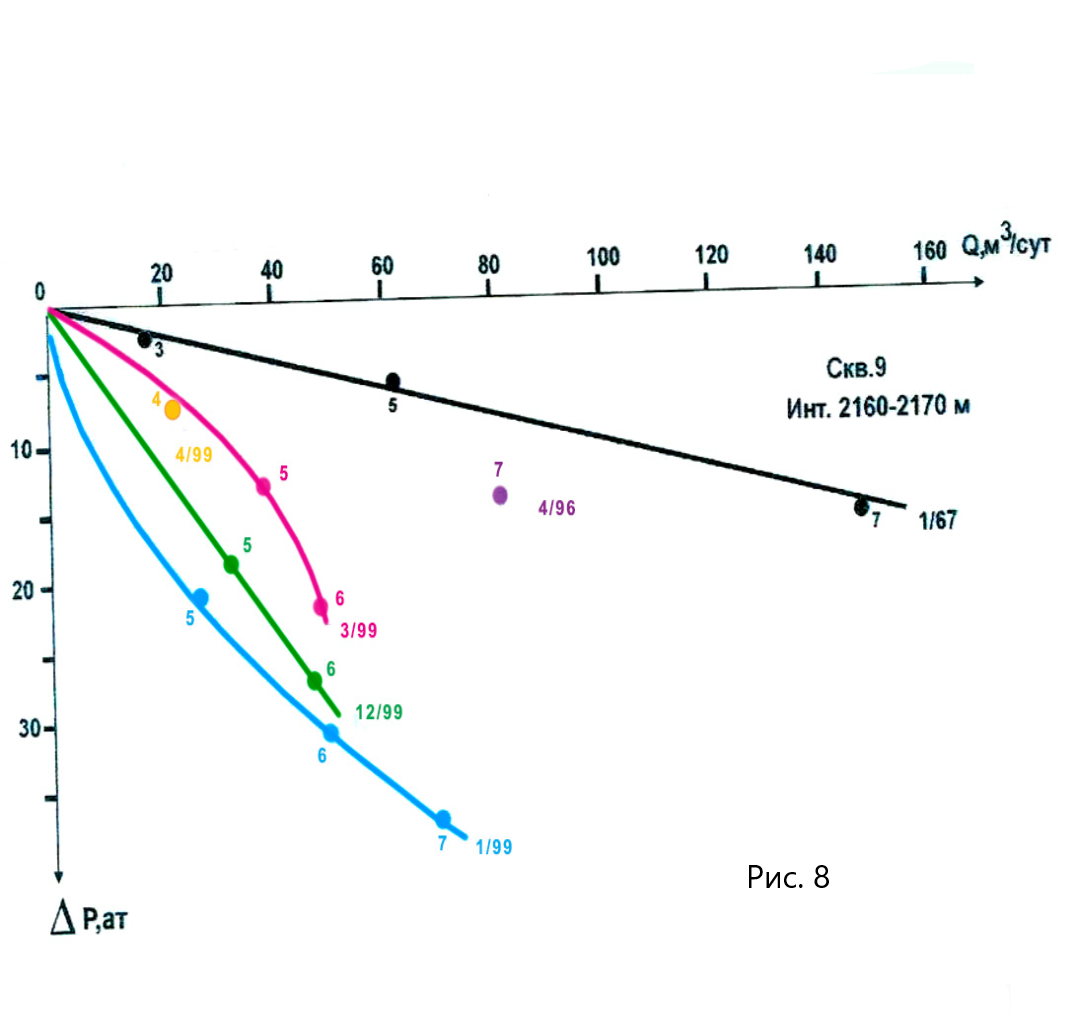
Fig. 8. Dynamics of IPR Curves Changing Across Time. Number of points-Choke Diameter (mm), near the IPR ends.
– date (month/year)
- If no regular well flow tests are carried out, it is possible to judge about deformation processes taking place in an occurrence using measurements of bottom-hole pressure values with chokes of permanent diameter. Changed fractures openness and, correspondingly, their permeability are reflected in changed values of bottom-hole pressure.
- Example from practice. 7 measurements were made during the period of 03.04.2000-22.12.2000 г. in a well where fractured sandstones were oil production target which registered the increase of bottom-hole pressure (choke = 8mm) from 10.2 MPa to 16.4 MPa. Bottom-hole pressure (7 measurements were taken) decreased from 16.4MPa to 10.8 MPa during the period of 23.12.2000-14.06.2001 and increased up to 12.4 MPa during the next measurement taken on 13.08.2001. The presented data can be interpreted in the following way: during the period of 03.04.2000-22.12.2000 the processes of matrix rock breaking and greater concentration of fractures are prevailing in the mass of rocks having effect on well performance; the period of 23.12.2000 – 14.06.2001 – processes of elastic-and-plastic deformations are prevailing in the rock volume having effect on well performance, resulting in reduced fractures opening and their permeability; following 14.06.2001 processes of rock breaking start dominating and concentration of fractures grows. Similar results were registered across multiple occurrences with fractured reservoirs.
- Processes of rock deformation are reflected in the results of well interference testing in the following way. If an occurrence is composed of fragile rocks, the growing concentration of fractures contributes to formation of new hydrodynamic ties. They can be detected by periodic interference well testing between the same pairs of wells. For example, a series of interference well tests was carried out on an occurrence composed of this type of rocks where one and the same pair of wells served as active well and observation well. . In this pair of wells, with the distance of 1800 m between them, no well interaction was detected; a repeated interference testing in 26 months registered a distinct interaction. The other pair of wells of the same occurrence, the distance between them being 750 m, showed no interaction during primary interference testing; the second interference testing, 7 months later, registered well interaction, which was additionally confirmed by the third interference testing 6 more months later.
If an occurrence is composed of elastic-and-plastic rocks and plastic deformations are not vividly expressed, an interference well testing most often would not show direct interaction between surveyed wells, although the objects under study refer to a single flow net. This is determined by the fact that due to plastic flow of rocks closing of fractures takes place in a shut-in well and pressure impulse does not reach a detecting instrument. The deformation type of rock can be defined by the IPR pattern. The IPRs of fragile rocks coincide in the drawdown and buildup modes (i.e. consequent increment and decrement in choke diameter) while the IPRs of the drawdown and build up modes are quite different from each other when we deal with elastic and plastic rocks.
Deformation processes related to the matrix rocks of a fractured reservoir can be managed by swapping the operating chokes: incrementing choke diameter accelerates the processes of deformation while decrementing reduces them. Water injection with the view to increase or maintain formation pressure is in its way a method to stabilize deformation processes. In other words, managing deformation processes in an occurrence with fractured reservoirs can be a simple and efficient way of management, field development and oil production.
Conclusion
A fractured reservoir is a subsurface rock divided by subvertical open fractures making up a single flow network. The network itself is very sensitive to external and internal stresses on the rock and can immediately react to those changes by changing in well productivity. The variations of stresses can in certain way be controlled and modified making it possible to manage the process of field development and oil production using simple and available methods.
Sources
- G.I.. Barenblatt, Y.P. Zheltov and I.-N. Kochina Basic Concepts in the Theory of Seepage of Homogeneous Liquids in Fissured Rocks. Applied mathematics and mechanics. Academy of Sciences USSR, issue 5, 1960 p.852-864.
- K.G.Boltenko, A.I.Echeistov, S.F.Zdorov. Basic results of the study of fractured rocks at Yaregankskoye oil field. Works of the 2nd All-Union Meeting on Fractured reservoirs of oil and gas. Moscow “Nedra”publishing house, 1965, p.233-240.
- B.I. Vilge, K.G.Waxman, Y.A. Limberger, V.M.Ilínsky “Induction Logging in Subsurface Rocks with Vertical Open Fracturing. Applied geophysics., 1989, Issue 121, p.201-207.
- T.D. Golf-Racht “Fundamentals of Oil Field Geology and Fractured Reservoir Engineering”. Moscow, “Nedra”publishing house, 1986, p.608.
- V.N. Dakhnov “Electrical and Magnetic Methods of Well Survey” Moscow “Nedra”, 1967, p.390.
- Y.A Limberger, V.M.Il’insky. “New Approach to Delineation of Fractured Rocks by the Results of Well Logging”. Geology of oil and gas, 1978, Issue 11, p.58-63.
- Y.A.Limberger, B.I.Vilge, V.M.Il’insky, K.G.Waxman. “Delineation of Open Fractures in Well Column Using the Results of Induction Logging”. Geology of Oil and Gas, 1986, Issue 5, p.14-18.
- Y.A.Limberger, V.M.Il’insky, T.G.Radchenko “About the Potential of Fluid Flow in Fractured Reservoirs of the Kuma Horizon of Krasnodar Territory”. Geology of Oil and Gas, 1986, Issue 8, p.17-22.
- Y.A.Limberger, B.I.Vilge. “About the Potential of Fluid Flow in Oil Wells. Issues of Enhancing the Efficiency of Field Geophysical Survey (Collected Academic Papers of CGE). Moscow, VNIIOENG, 1989, p.19-28.
- Y.A. Limberger “Hydraulic Fracturing Simulators: their potential and limitations”. ROGTEC. Issue 60 p.54-67.
- Y.A. Limberger. “Is There Actually Oil in the Bazhenov Suite?” ROGTEC. Issue 66 p.68-81.
- I.V. Tatarinov “The Role of Fracturing in the Fluid Flow and Reservoir Capacity at Yaregskoye Oil Field.” Works of the 2nd All-Union Meeting on Fractured Reservoirs of Oil and Gas. Moscow, “Nedra” publishing house, 1965, p.167-171.
- Y.A.Limberger, V.M. Il’inskiy. “A New Approach to Recognition of Joined Rocks Based on Results of Drill-hole Geophysical Studies.” International’Geology Review, 1980, vol.22, №7. p.831-835.


 by
by