水平井生产测井在油气田战略开发中起着至关重要的作用。然而,由于流动模式复杂,传统的储层评估诊断方法往往难以准确解释井性能。本文讨论了新的 3D 温度和频谱声学建模和测井方法的概念、应用和持续发展。该方法已在各种现场试验中经过严格测试,涵盖了各种完井设计、测井条件和作业类型,这些试验验证了建模方法的有效性并阐明了其潜力。
理论背景和建模
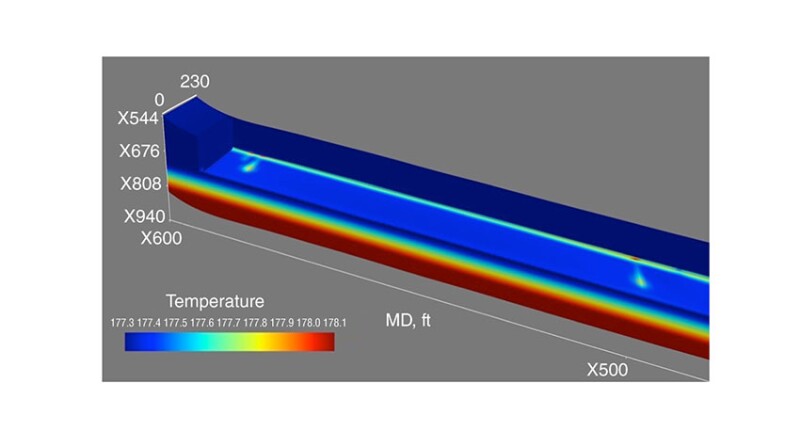
全文的这一部分全面概述了最近开发的用于定量解释水平井温度和压力测井数据的热物理模型。
水平井生产测井在油气田战略开发中起着至关重要的作用。然而,由于流动模式复杂,传统的储层评估诊断方法往往难以准确解释井性能。本文讨论了新的 3D 温度和频谱声学建模和测井方法的概念、应用和持续发展。该方法已在各种现场试验中经过严格测试,涵盖了各种完井设计、测井条件和作业类型,这些试验验证了建模方法的有效性并阐明了其潜力。
全文的这一部分全面概述了最近开发的用于定量解释水平井温度和压力测井数据的热物理模型。
Production logging in horizontal wells plays a critical role in the strategic development of hydrocarbon fields. However, conventional diagnostic methods for reservoir evaluation often face challenges in interpreting well performance accurately because of complex flow patterns. The complete paper discusses the concept, applications, and continual evolution of a new 3D temperature and spectral acoustics modeling and logging approach. This methodology has undergone rigorous testing across diverse field trials, encompassing a variety of completion designs, logging conditions, and operational types, that have validated the effectiveness of the modeling approach and illuminated its potential.
This section of the complete paper provides a comprehensive overview of a recently developed thermophysical model designed for the quantitative interpretation of temperature and pressure-logging data in horizontal wells.