钻深井的一个主要理由是管理和保持浅层压力。新墨西哥州监管机构已采取积极措施来实现这一结果。2016年,新墨西哥州能源、矿产和自然资源部的石油保护部门实际上暂停了浅层处置,因为担心地层压力升高和水流会对新生产井的钻探产生不利影响。通过比较新墨西哥州钻探的浅处置井比例与德克萨斯州直接跨越边境钻探的浅井比例的历史趋势,这一监管行动的结果是显而易见的(图7)。然而,RRC 也承认浅层压力是一个令人担忧的问题。在 2020 年发给处置井许可证申请人的“索取更多数据”信函中,RRC 表示,圣安德烈斯流层“值得关注 H 2 S 流量和超压”。
Permian Basin oil wells produce a lot of water. Much of it is injected into disposal zones above and below the basin’s primary oil- and gas-producing zone. When water is injected into these disposal zones, the pressure increases, mainly because no fluid is concurrently removed. Is this increase in pressure a concern? The data would suggest yes.
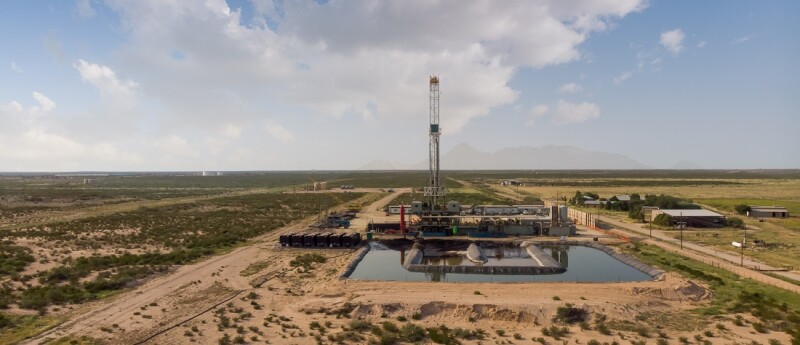
Source: grandriver/Getty Images
35 billion barrels. 1.5 trillion gallons. 1 Toledo Bend Reservoir (the largest lake in Texas).
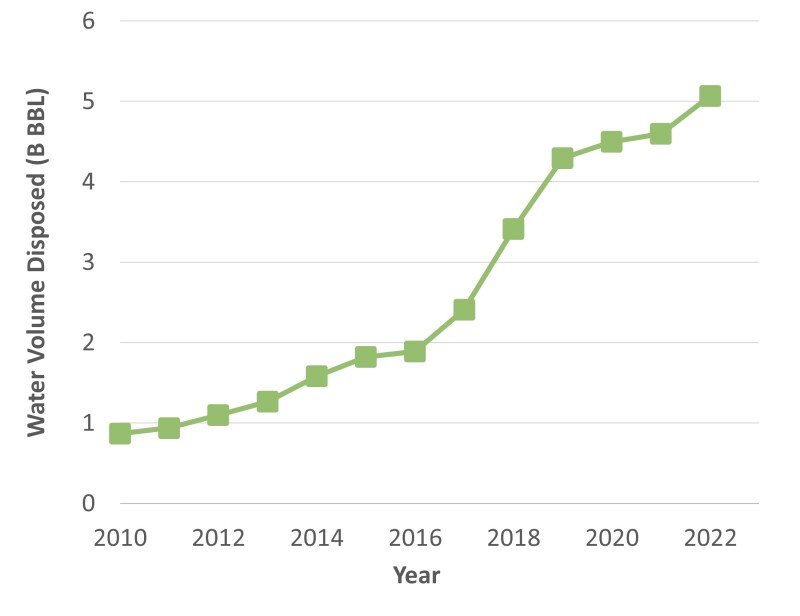
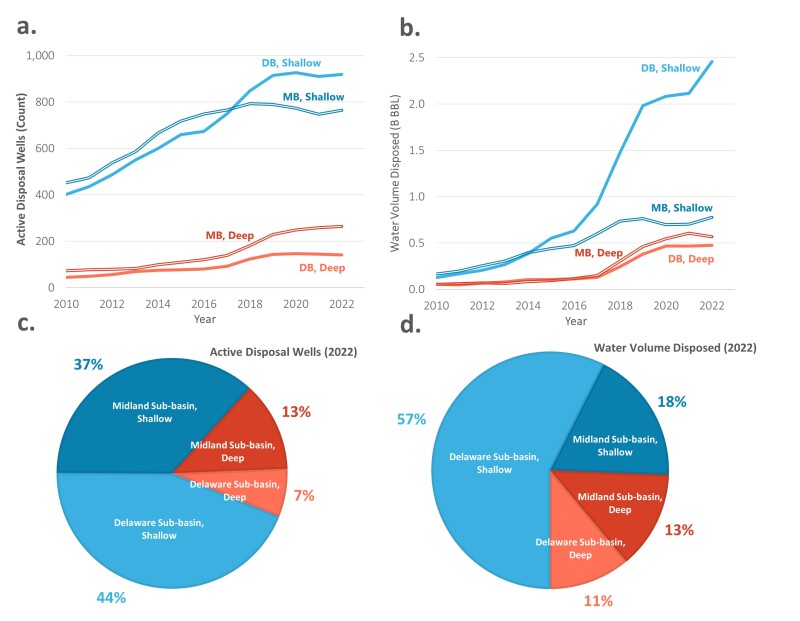
That’s roughly the volume of Permian Basin oilfield produced water (i.e., water produced during oil and gas extraction) that has been injected underground for disposal since the beginning of the US shale revolution. Despite greater use of this produced water to complete new oil and gas wells, the amount of water disposed into the subsurface has increased yearly (Fig. 1), from just under 900 million bbl in 2010 to over 5 billion bbl in 2022, a nearly sixfold increase. This number is forecast to grow to about 7 billion bbl by 2030, according to data from B3 Insight.
Fig. 1—Permian Basin oilfield produced water disposal volume by year.
Source: B3 Insight
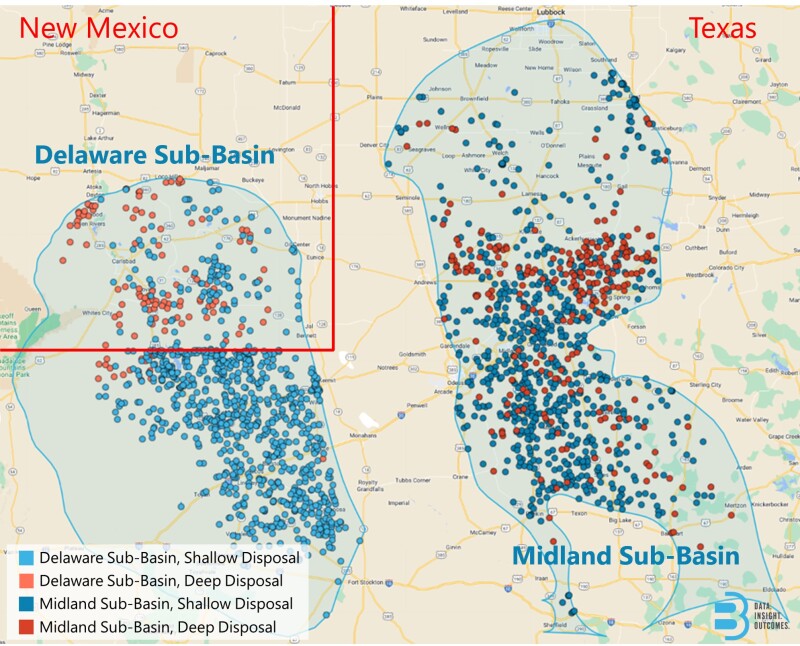
Currently, 85% of the Permian Basin’s produced water is disposed of via more than 2,000 injection wells in the Delaware and Midland sub-basins, the predominant areas of Permian Basin unconventional oil and gas development (Fig. 2).
Fig. 2—Active disposal wells in the Delaware and Midland sub-basins, symbols colored to distinguish sub-basins and depths.
Source: B3 Insight
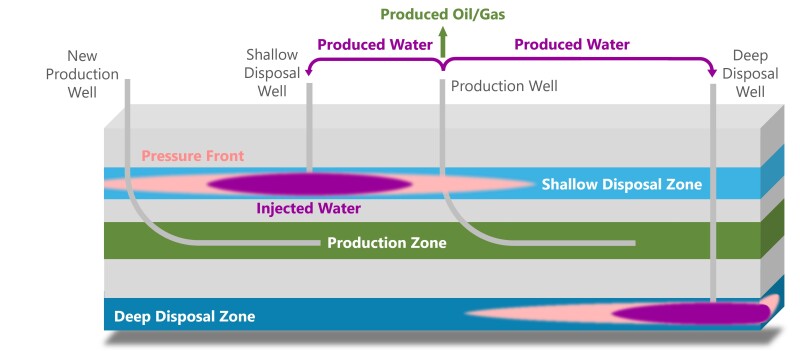
Because of the low permeability of the reservoir rocks where the water originated, the unused produced water is not easily injected back into the producing formations. Instead, the vast majority is injected into “shallow” disposal zones (e.g., the Delaware Mountain Group in the Delaware sub-basin and the San Andres Formation in the Midland sub-basin) and “deep” disposal zones (e.g., the Fusselman, Devonian, and Ellenburger formations) situated above and below, respectively, the Permian Basin’s primary unconventional oil- and gas-producing formations (Fig. 3).
Fig. 3—Illustration of Delaware sub-basin and Midland sub-basin oilfield water production and disposal. Shallow disposal zones lie above the principal unconventional oil- and gas-producing formations, while deep zones lie beneath.
Of the over 2,000 injection wells noted, approximately 80% are currently used to inject oilfield produced water into shallow disposal zones, with roughly an equal split between the Delaware and Midland sub-basins (Figs. 4a and 4c). And, while a similar percentage (75%) of the associated water volume is injected into the shallow disposal zones versus deep zones, more than half of the total water volume (both shallow and deep in both sub-basins) is injected into the shallow formations of the Delaware sub-basin (Figs. 4b and 4d).
Fig. 4—a) Number of active shallow and deep disposal wells in the Delaware and Midland sub-basins since 2010. b) Volume of oilfield produced water disposed into shallow and deep zones in the Delaware and Midland sub-basins since 2010. c) Percentage of active shallow and deep disposal wells in the Delaware and Midland sub-basins for 2022. d) Percentage of oilfield produced water volume disposed into shallow and deep zones in the Delaware and Midland sub-basins for 2022.
Source: B3 Insight
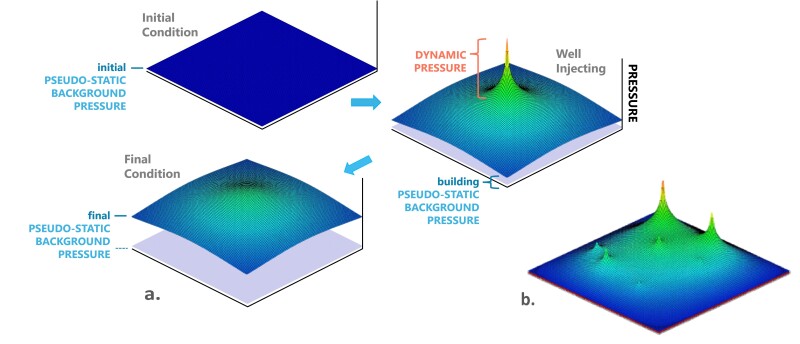
The Pressure Response When water is injected into these disposal zones, the pressure increases (Fig. 5a), mainly because no fluid is concurrently removed (unlike waterflooding operations, where oil, gas, and water are simultaneously produced). During active injection, a cone of pressure buildup develops at and away from the wellbore, the size and shape of which are dictated by a host of factors including the injection rate; the injection history; properties of the water, well, and rock; and the presence of other active injection [pressure is additive among overlapping pressure cones (Fig. 5b)].
Fig. 5—a) Illustration of the pressure distribution before, during, and after active injection. b) Depiction of overlapping cones of pressure buildup among multiple actively injecting wells.
Once wells stop injecting, given enough time, these dynamic pressure cones dissipate and pressure returns to its initial background state. However, if a large enough volume is injected, the background pressure (i.e., the pressure in the absence of active injection) also measurably increases as structural and stratigraphic changes restrict continued fluid migration and hinder pressure dissipation. In essence, the system behaves like a sealed tank.
While this background pressure tends to change relatively slowly and steadily (hence the terminology “pseudo-static” used in Fig. 5a) compared with the more local and abrupt pressure perturbations around active injection wells, the resulting pressure increase is broader spatially and potentially much longer-lasting, even extending beyond the timescale of field development. So, while operators can actively manage the elevated pressure near active injection wells by curtailing injection (though this introduces a separate set of logistical challenges to redirect the water to alternate disposal locations), there is little immediate recourse to reduce the more insidious rise in background pressure. In essence, the tank fills up without a way to empty quickly.
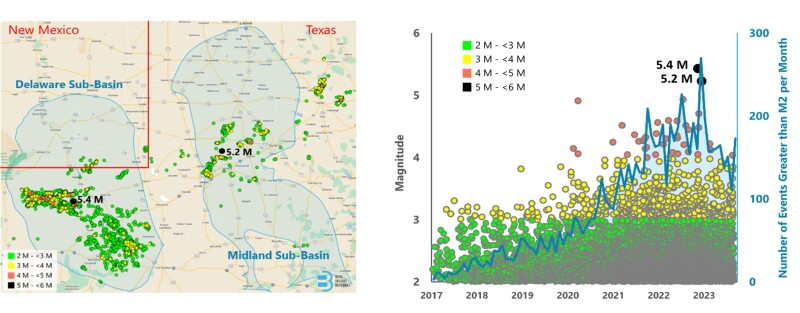
Is Pressure a Concern? The data would suggest unequivocally yes. The most discernable impact of water disposal affecting formation pressure is the steep rise in the frequency and magnitude of Permian Basin earthquakes (Fig. 6). While shallow disposal, deep disposal, and hydraulic fracturing may all contribute to area seismicity, attempts since 2021 by the Texas Railroad Commission (RRC) to mitigate induced seismic events have focused primarily on restricting deep disposal within designated seismic response areas (SRAs). Furthermore, in February of this year, the RRC announced that it would add additional requirements to new Permian Basin disposal well permits “… to assist the agency and industry in monitoring and responding to injection and reservoir conditions that may be conducive to induced seismicity.” This includes installing bottomhole pressure monitoring gauges on all new deep disposal wells in the Permian Basin and all new shallow disposal wells within the SRAs.
Fig. 6—Location, magnitude, and frequency of Permian Basin seismic events, 2017 to present.
Shallow Pressure Impacts: Regulators But why dispose of oilfield water into deep formations in the first place? Shallower wells generally are more straightforward to drill and complete, with lower capital and operating costs. And this explains, in large part, the proliferation of shallow disposal wells noted previously.
A principal justification for drilling deep wells is to manage and preserve shallow pressure. New Mexico regulators have taken proactive measures to achieve this outcome. In 2016, the Oil Conservation Division of New Mexico’s Energy, Minerals, and Natural Resources Department effectively placed a moratorium on shallow disposal over concerns of elevated formation pressure and water flows adversely affecting the drilling of new production wells. The result of this regulatory action is evident when comparing historical trends in the fraction of shallow disposal wells drilled in New Mexico against the fraction of shallow wells drilled immediately across the border in Texas (Fig. 7). The RRC, however, has also acknowledged shallow pressure as a concern. In a 2020 “Request for Additional Data” letter sent to a disposal well permit applicant, the RRC stated that the San Andres “is a formation of concern for H2S flows and overpressure.”
Fig. 7—Percentage of new Delaware sub-basin disposal wells drilled for shallow disposal, distinguished by state.
Source: B3 Insight
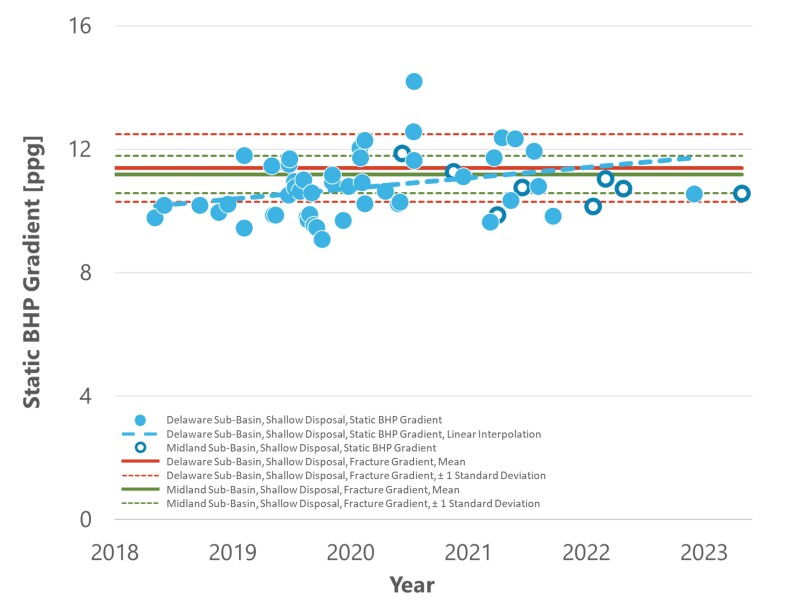
The notion that the background pressure is increasing in the shallow disposal zones is substantiated by injection well pressure measurements. Aggregated pre-injection bottomhole pressure data (i.e., pseudo-static background pressure) from step-rate injection tests conducted over the past 5 years suggests the pressure gradient (i.e., pressure normalized to depth) is increasing, particularly within the Delaware sub-basin (Fig. 8). Additionally, the data show how close the pressure gradient is to the injection zone fracture gradient (i.e., the pressure at which the rocks begin to break), with the latter data also derived from the step-rate injection tests. B3 Insight has validated and further refined these results in its Subsurface Interval Pressure model by integrating the step-rate injection test data with injection well construction/completion, injection volume, and surface pressure data using trained machine learning models. Analysis of 2017–2023 injection shows a basinwide average increase in shallow background pressure of 9% for the Delaware sub-basin and 3% for the Midland sub-basin.
Source: Data from B3 Insight
Shallow Pressure Impacts: Exploration and Production Companies Concerns about shallow pressure and the measures to mitigate are not just confined to regulators. Several operators have publicly acknowledged concerns about formation integrity while drilling and the need for extra strings of casing to manage pressure. Pioneer Natural Resources, in a February 2018 investor presentation, noted that using a four-string casing design in the Midland sub-basin “eliminates the challenges of balancing mud weights between high and low pressured intervals experienced utilizing a three-string casing design,” where the “… intermediate casing is set from the surface through the higher-pressured disposal zone.”
Guidon Energy (acquired by Diamondback Energy in 2021) described in a presentation titled “The San Andres Problem” how it modified the casing design for Midland sub-basin production wells, adding an extra liner at a $600,000 incremental cost, to manage drilling between the "over-pressured" San Andres formation and the weaker underlying Clearfork and Upper Spraberry formations (also reported by JPT in February 2019). Guidon Energy further noted increased lost circulation and differential sticking events and expressed worry that, as pressure rises, San Andres kill mud will soon fracture the rock.
Analysis of well construction history, particularly the number of casing strings used, corroborates these public statements. While pressure alone does not dictate the number of casing strings used, the data does show an increase in horizontal wells drilled with four or more casing strings over the past decade, particularly in the Midland sub-basin. While the percentage of the wells in the Delaware sub-basin drilled with four or more strings has generally hovered between 40% and 50% dating back to 2014, the percentage of wells in the Midland sub-basin has increased from 10% to nearly 30%. Over the same timeframe, there has been no appreciable change in average drilling depth (Fig. 9).
Figure 9—Trends in the number of casing strings used for Delaware and Midland Sub-basin horizontal production wells.
Source: B3 Insight
Shallow Pressure Impacts: Disposal Well Operators From a produced water disposal perspective, increasing pressure also means less disposal capacity. In Texas, each disposal well’s operation is constrained by a well-specific permitted maximum daily injection rate and maximum wellhead pressure established by the RRC. And, in the Permian Basin, wells generally reach the permitted maximum injection pressure before reaching the maximum injection rate. All else being equal, the higher the initial pressure, the more quickly a well will reach its maximum permitted pressure when injecting. So, while Texas shallow-well disposal well operators are, on average, using approximately 25% and 15% of the total permitted rate in the Midland sub-basin and Delaware sub-basin, respectively, they are using an average of 60% and 45% of the permitted pressure.
Beyond the Permian Basin The nexus of water and pressure management is not just a Permian Basin concern. Operators in southeast and east Texas, Oklahoma, and North Dakota also face challenges with the influence of water disposal on formation pressure and seismicity. Oil and gas development is a highly interconnected enterprise; one company’s actions can significantly affect another’s operations. The question is, can the industry work toward a common goal of long-term pressure maintenance that minimizes operational and environmental risk before areas are compromised long-term?
Furthermore, as activity builds around carbon capture and storage, it will be crucial to apply the lessons learned from oilfield produced water injection, particularly to areas where geologic CO2 sequestration, water disposal, and production operations may be in proximity, or even overlap. Well-considered, well-informed, and well-communicated cooperative oversight and management of the subsurface pore space will be essential to ensure the long-term viability and effectiveness of operations with possibly otherwise competing objectives and outcomes.